 Reading Time: 4 minutes
Most, if not all, large insurance and re-insurance carriers today work with brokerage agencies to grow their books and ensure a healthy stream of business. Depending on the carrier size, they might often work with dozens of agencies spread across the globe, each with its own operating processes and ways of working. For broker managers, monitoring agency performance and working with them to target the right lines of business, suitable policies and the right customers can be a nightmare. The need to be able to quickly analyze broker performance and take corrective actions to meet submissions. As such, underwriting targets is critical. Lumin’s Decision Intelligence capabilities make this task considerably simpler. Let’s dive in.
Data used
We will look at how portfolio managers can analyze broker performance over time and make decisions to improve underwriting. The data for this solution consists of:
- Policy Submission: This includes key measures such as Written and Gross Premiums, Deductions, Commissions and others
- Key dimensional information around the policy: This includes insured party details, the specific line of business, the type and nature of policy (new vs renewed) and dates of inception, renewal and expiry, etc.
- Key dimensional information around the Broker Agency: This includes their name, location, business lines, etc.
To power up the broker performance analysis solution, this data can be situated in any major cloud and on-premise data sources to which Lumin connects.
Exploration on Lumin
We can begin exploring our sample data by looking at the biggest brokers who we work with. Let’s start by asking Lumin some questions.
“What is the share of submissions across brokers?”
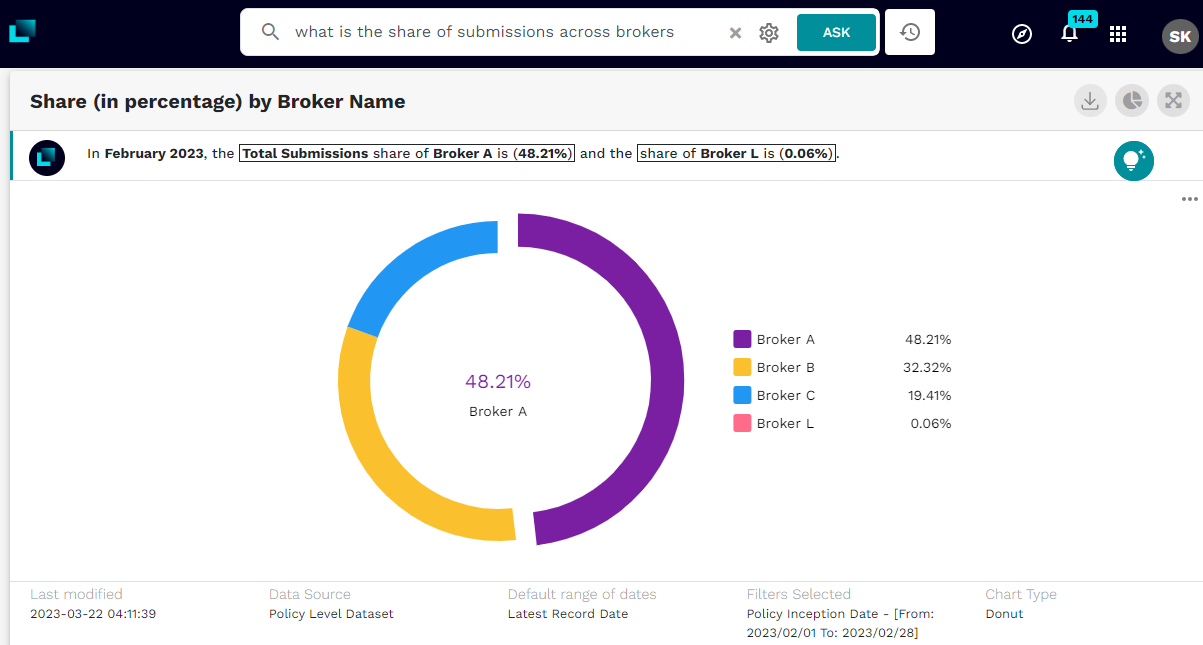
Image 1: Share of submissions across brokers
In February 2023, Broker A brought nearly half of all submissions. Let’s analyze Broker A performance over a period of time. This time we’ll look at the dollar value of the business that this broker brought and compare it over the same period last year.
“What is the Broker A GWP YTD 2023 vs. the prior year?”
We find a positive trend when comparing Broker A’s performance to the prior year. This broker has increased their overall business, measured as Gross Written Premiums (GWP), compared to last year’s period. It will be interesting to see which regions contributed to this growth and by how much. Let’s pose our next question to Lumin.
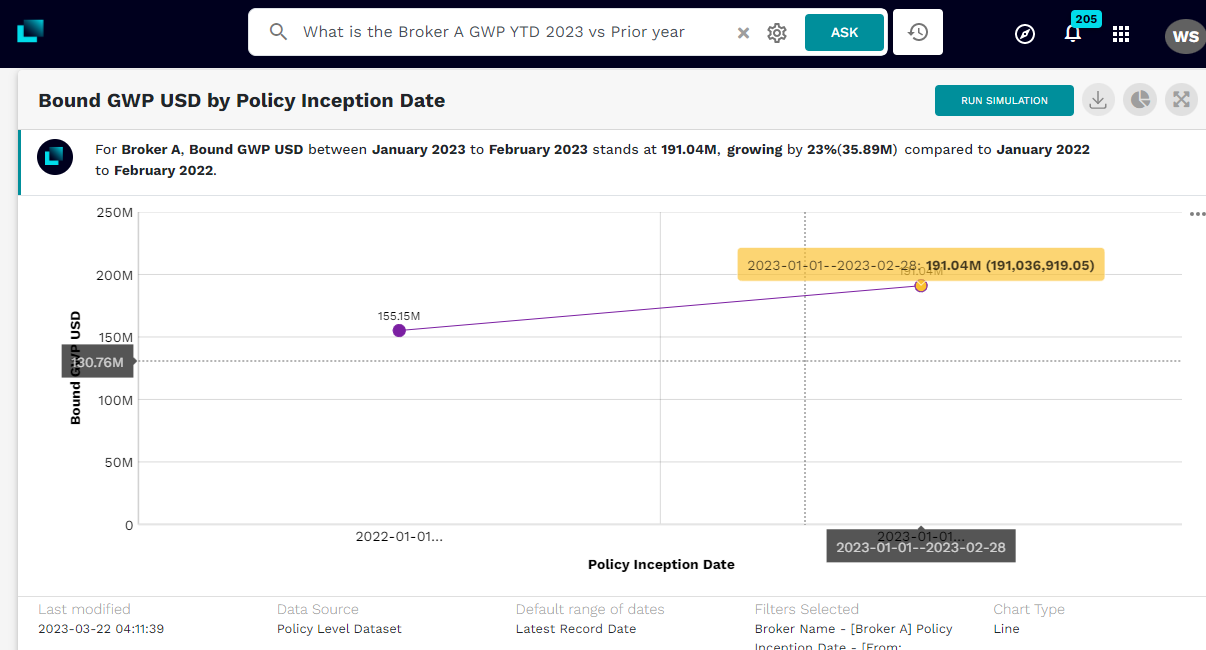
Image 2: Broker A GWP vs. prior year
What is the Growth contribution to Broker A GWP in YTD 2023 across regions?
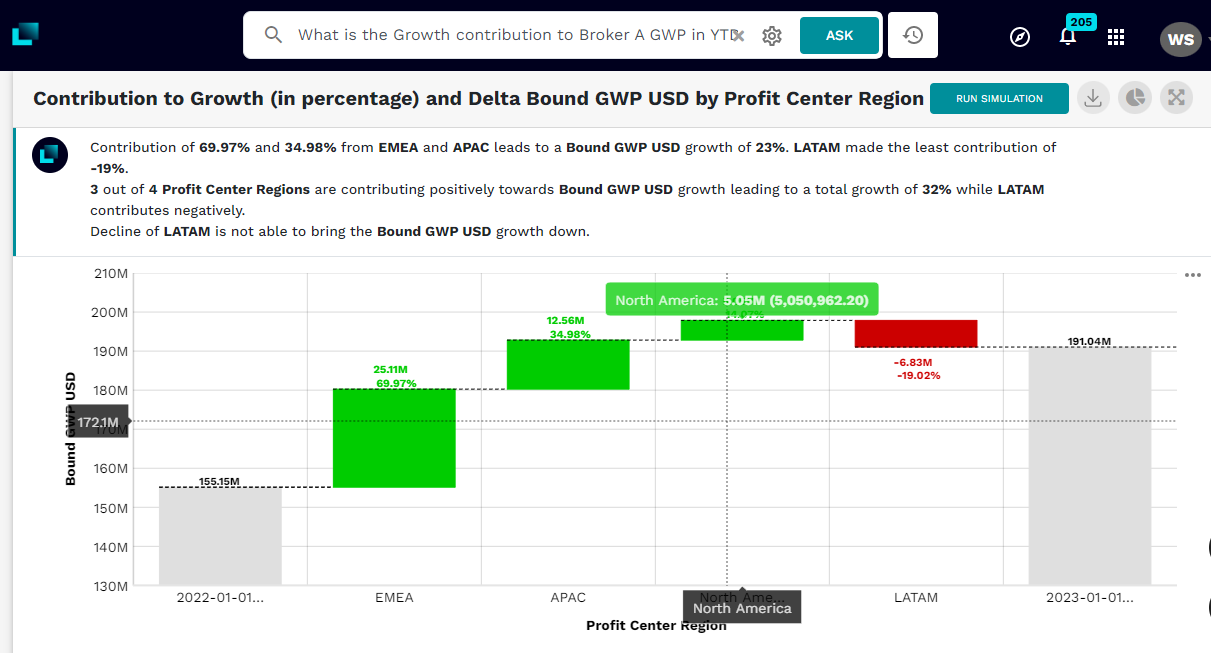
Image 3: Regions contributing to Broker A GWP Growth>
This question revealed that EMEA and APAC contributed significantly to Broker A’s premium growth, while LATAM premiums actually fell by around 20%. This is cause for concern and requires a deep dive into the region. Let’s use Lumin’s diagnostic capability to do this.
Why did Broker A LATAM GWP decrease in YTD 2023?
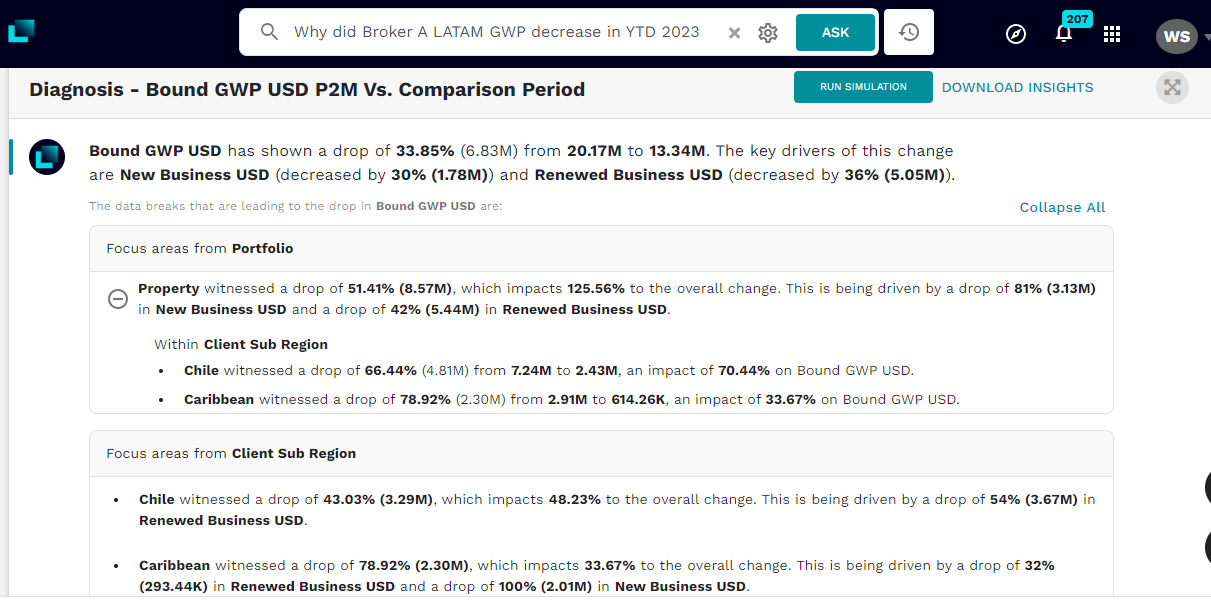
Image 4: Diagnostics of LATAM Premiums for Broker A
The deep dive of the LATAM Region identifies the key sub-regions and the lines of business where the drop has come from. The key drivers model of Lumin has also picked up the specific reductions in the renewed business and the new business that has impacted this drop in overall premiums. With the drivers now identified, we can simulate the impact of increased focus on renewals on the overall premiums. One such scenario is shown here, where we see a 20% increase in renewals. Even if new business were to drop by 10%, it would still result in a 9% bump in Gross Premiums.
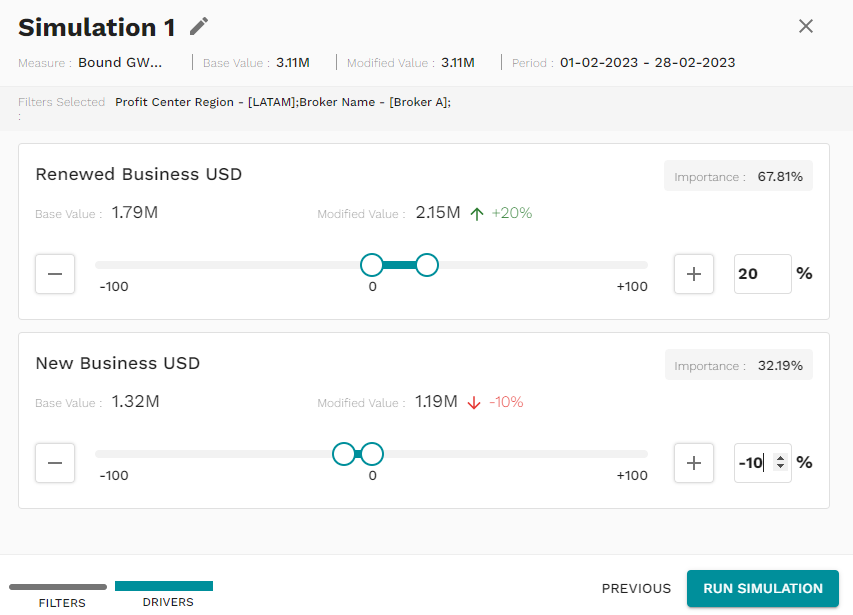
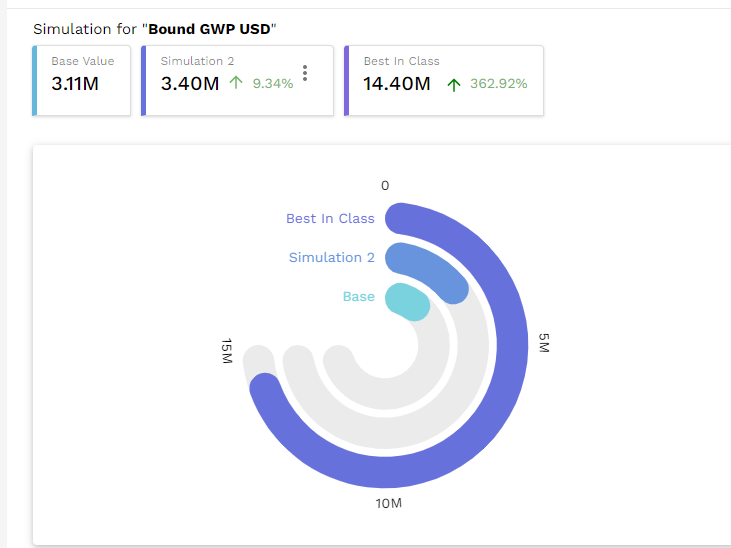
Image 5: Simulation on Increased Renewals
Through this analysis journey, we have gotten closer to a decision with each question. Having our agencies focus on renewals within specific portfolio types will likely get us the best return on our investments.
This type of analysis would typically take business teams several hours, if not days, to perform. On Lumin, it’s a matter of minutes.
