 Reading Time: 3 minutes
Storytelling with Connected Insights on Lumin
Humans have been hardwired to pay attention to stories since the beginning of humanity. When presented with meaningful stories, audiences are compelled to pay attention. This applies to data storytelling and analysis as well. Lumin by Fosfor is a Decision Intelligence product that already has storytelling features. Diagnostics answer the “why,” while simulation, forecast, and shared workspaces create intriguing data stories.
Connected Insights, the latest feature in Lumin 4.8, takes this to a whole new level. It enables the autonomous linking of insights and facilitates decision augmentation in Lumin. Let’s dig deeper into decision augmentation with recommendation-based analytics.
What is Connected Insights?
Connected Insights is a recommendation-based feature for insights created by Fosfor Lumin. It enables users to discover their next potential questions based on the insights present in their current results.
For a question asked by a user on Lumin, it identifies the key sub-texts of the insights generated for the question. The decision intelligence product then forms the questions which can be asked on these sub-texts. From here, this pathway opens up a list of recommended questions connected to the critical focus areas.
Effectively, connected Insights empowers you with possible future areas of analysis and helps narrate the story behind your data. A well-narrated story backed up with facts is the core of Decision Intelligence.
Connected Insights in action
Consider this scenario. Imagine you are the regional sales manager of a retail chain and wish to analyze the performance of various regions. In this case, you’ll start by asking Lumin about sales distribution across different regions. You could ask, “What is the share of sales across certain regions?”as seen in Figure 1 below
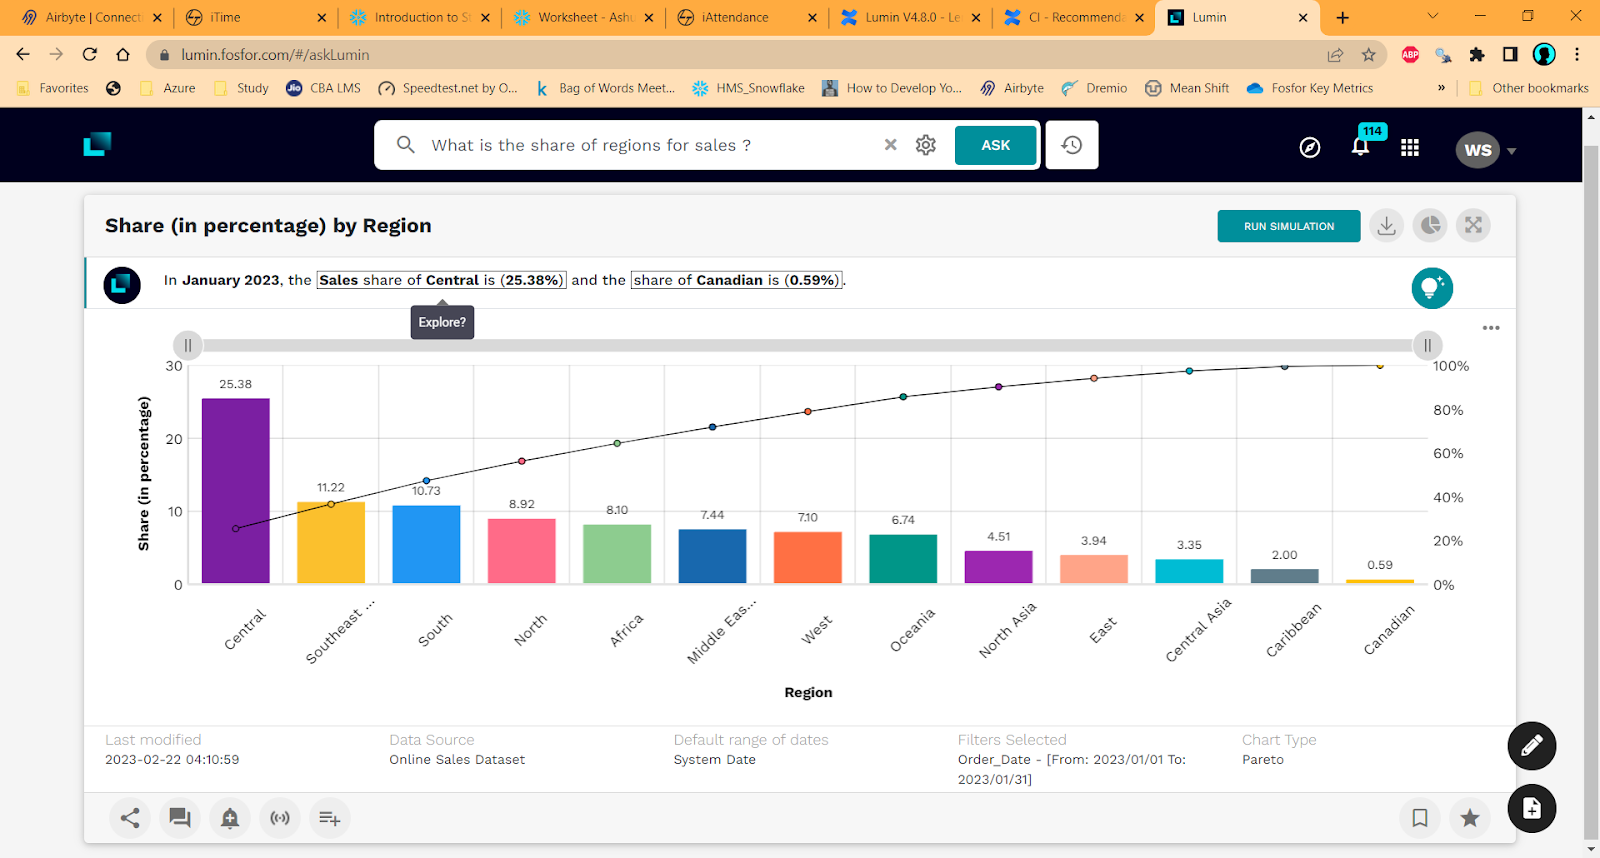
Figure 1: Insights on the share of sales across different regions
As seen in the Pareto chart in Figure 1, the central region has the highest share of sales. This data is useful, of course, but Lumin’s decision intelligence can do even more. It provides a list of connected insights so you can further drill down and discover more about sales in the Central region.
For instance, as depicted in Figure 2, it gives:
- The comparison of current sales in Central with the previous period
- The monthly growth rate of sales in Central
- The comparison of monthly contributions of Central sales and the overall growth of sales
- The forecast of sales in Central
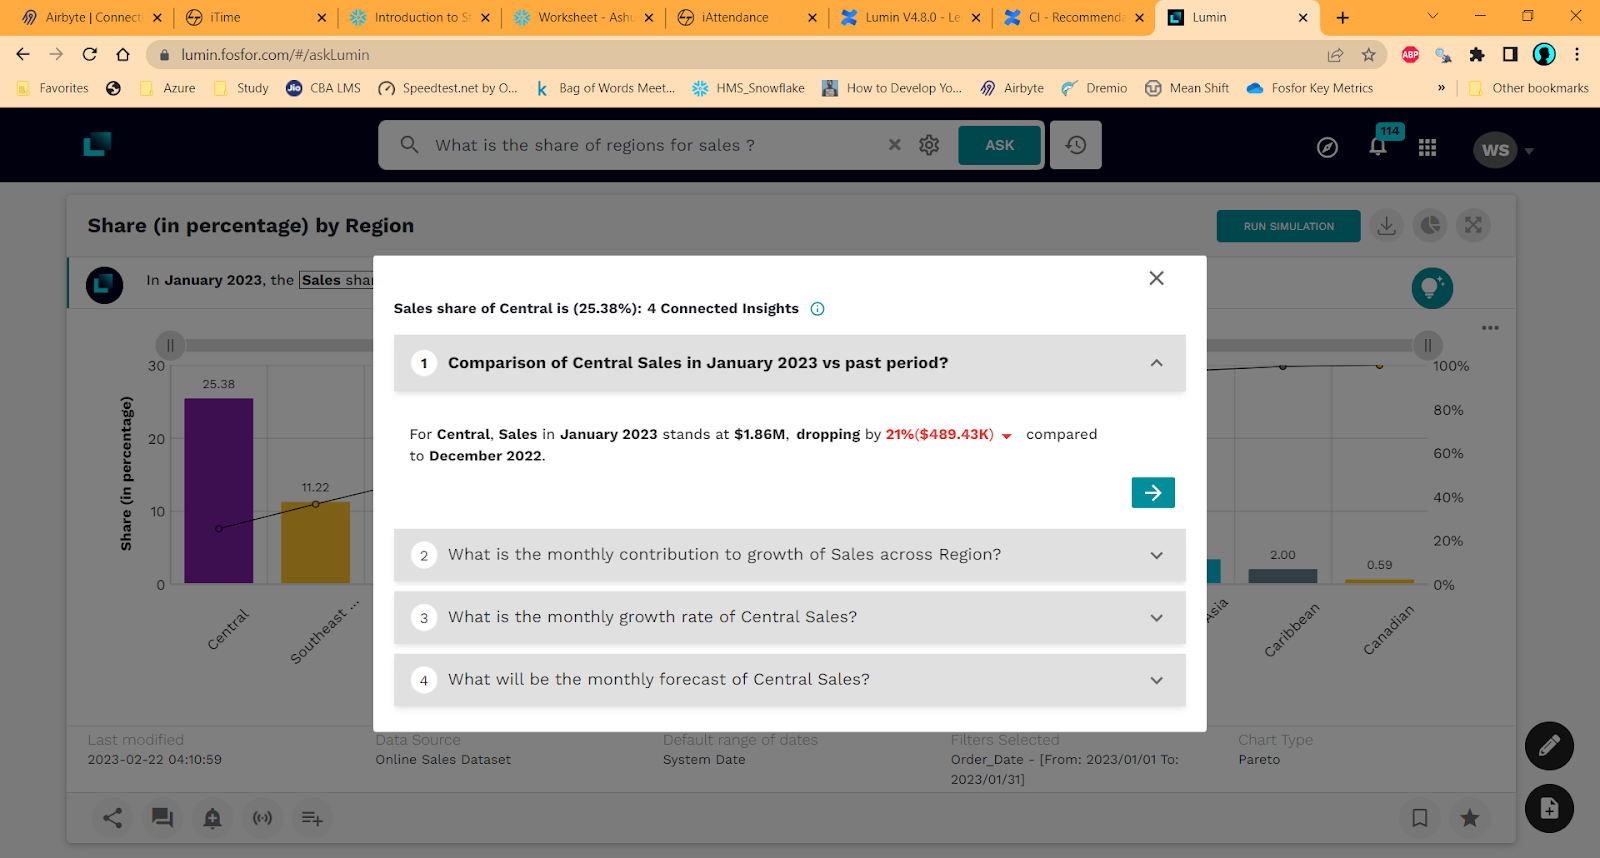
Figure 2: Connected Insights recommendation on share of sales for central region
This Augmented Intelligence revealed that Central’s sales are not as good as they looked in the first place.
Quick drill down on second insight as shown in Figure 3 tells that the Contribution to overall sales growth has been lowest from Central as compared to other regions.
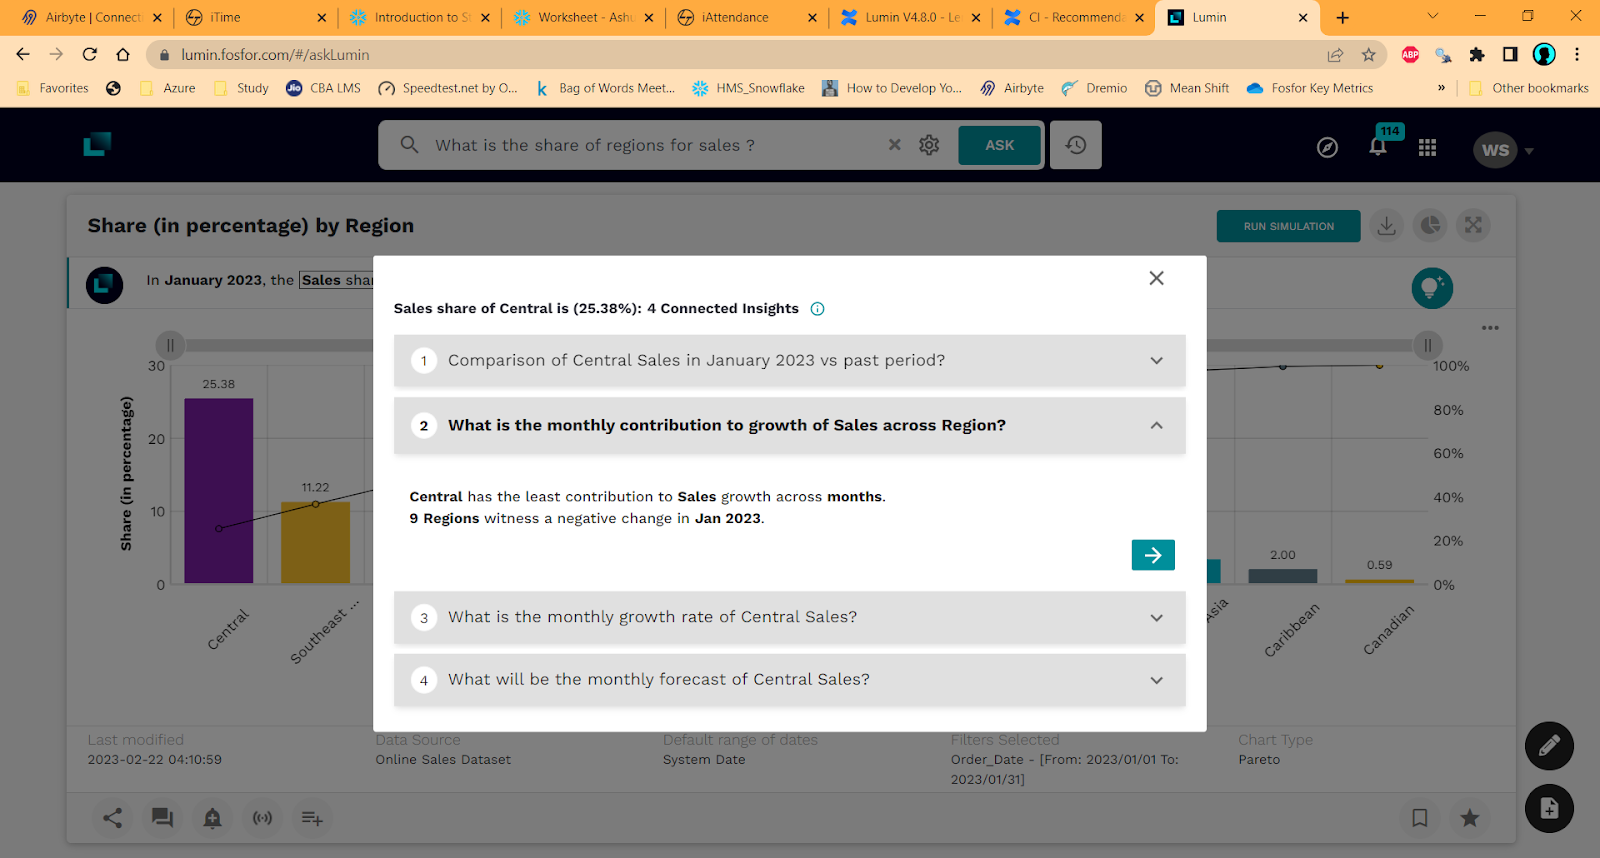
Figure 3: Drill down an insight for a quick view of the monthly contribution of Central sales
With this information, as seen in Figure 4 & 5 you can go on and follow the thread on any of the insights and get detailed visuals and narratives.
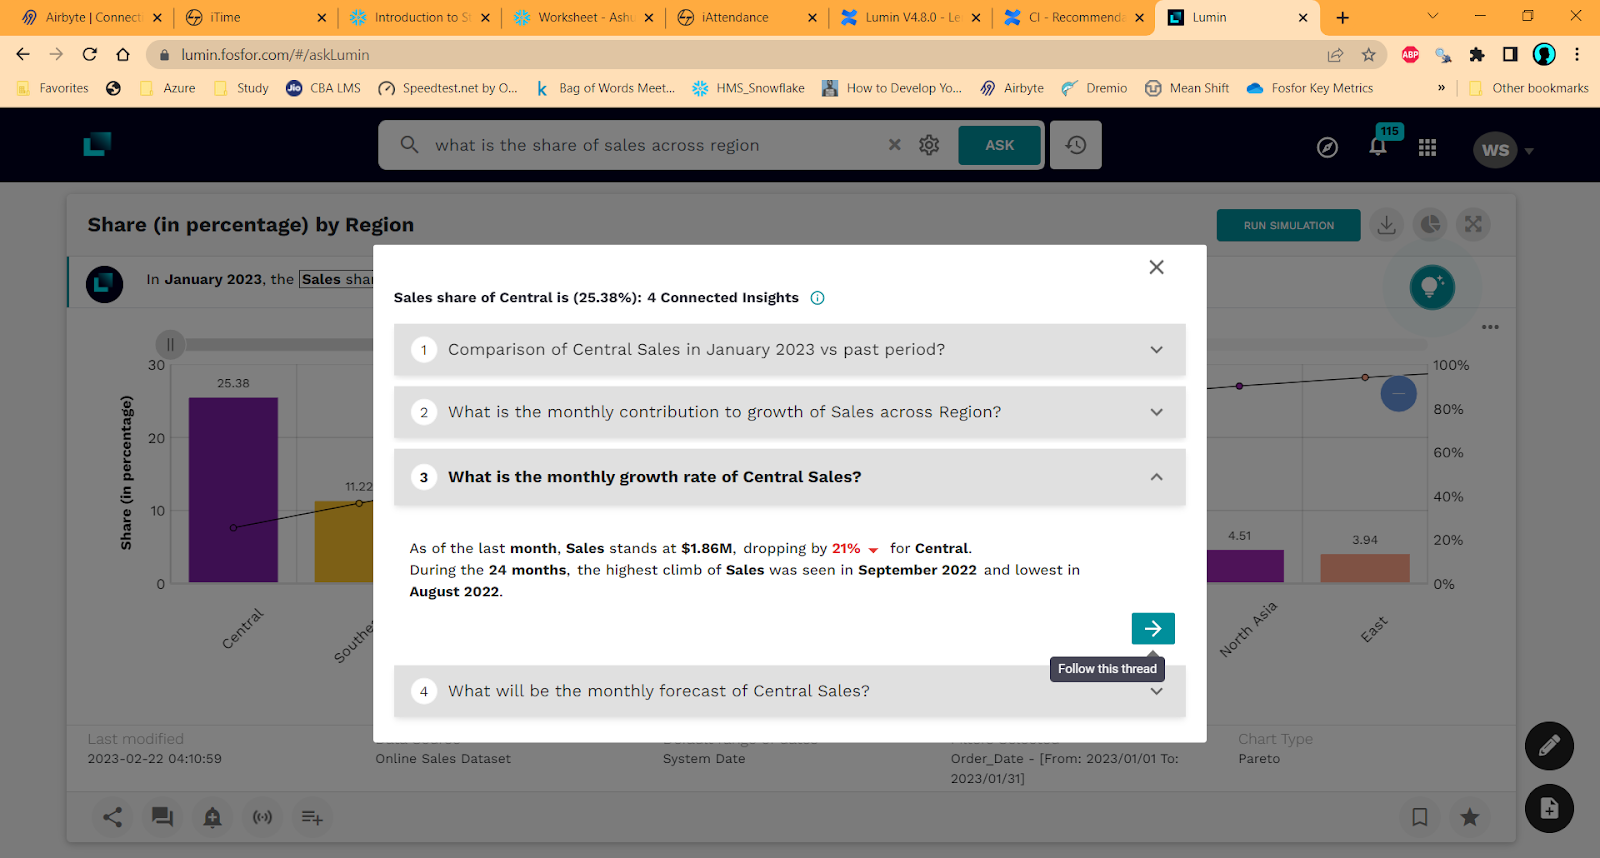
Figure 4: Follow the thread on the monthly growth of Central sales to know more.
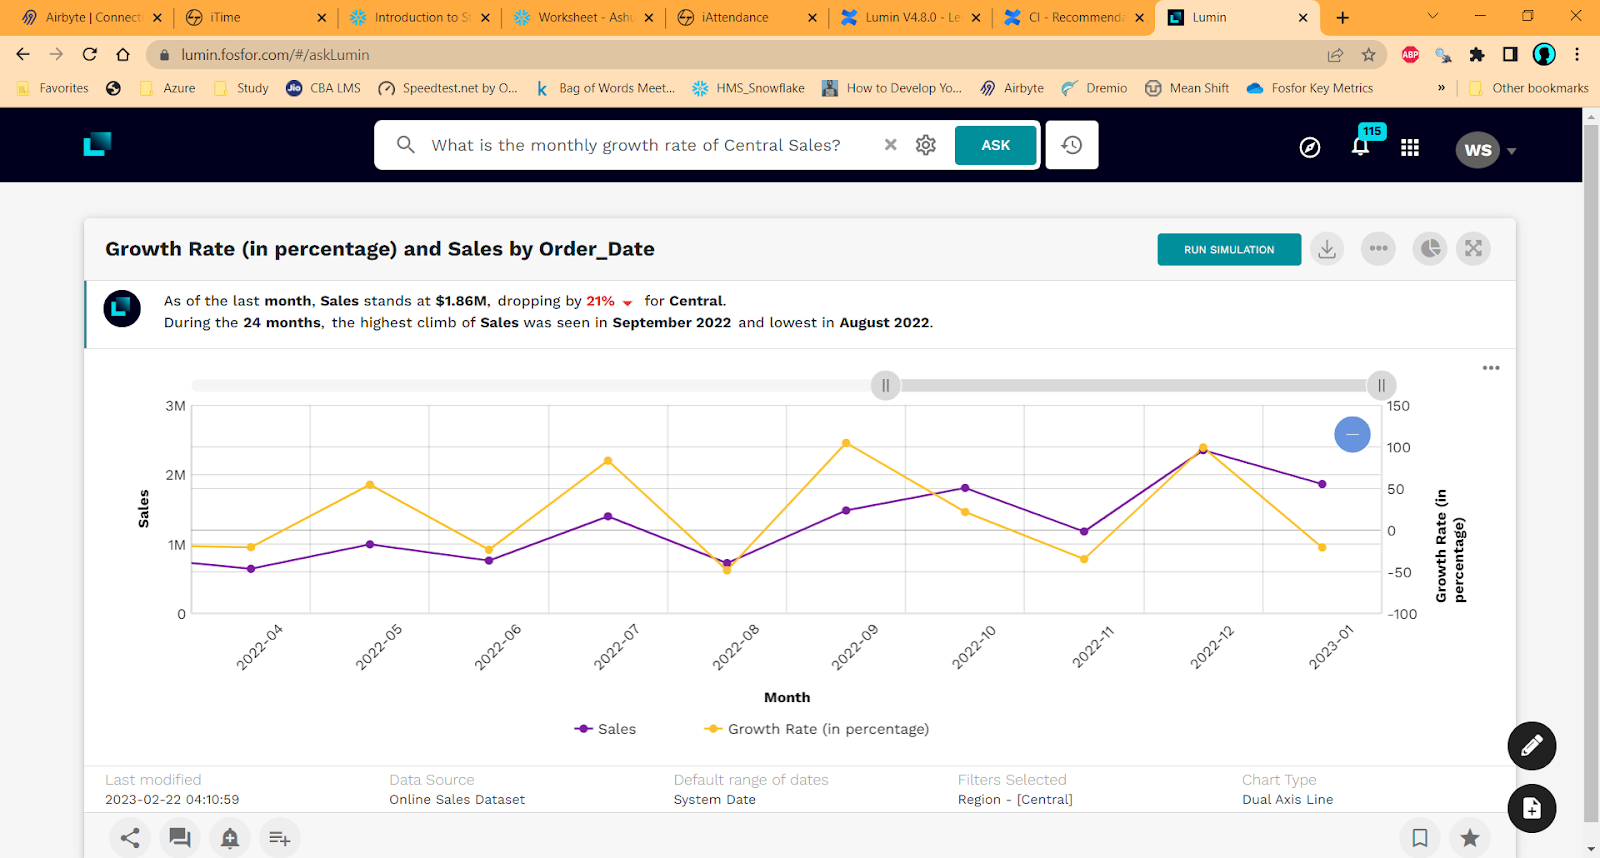
Figure 5: Detailed analysis of the monthly growth of Central sales
With Lumin, it is easy to follow insights in a connected thread and get what you want without asking for it. Insights like these and many more have always been there in your data. Most likely, they were lying unnoticed, and you just needed a remarkable tool to find them.
Ultimately, with focused insights like these, users can efficiently and promptly notify their decision-makers. This decision intelligence capability quickly becomes a tremendous time-saving element in decision-making and comes with multifold benefits. Let’s discuss those.
What value Connected Insights holds for customers
Connected Insights offers invaluable benefits for customers. It allows customers to:
- Connect the dots with little effort: Decision-making is all about connecting the dots in your data. Lumin does that investigative process autonomously for you in a concise manner. For example, in a supply chain process, inventory managers can get all the insights into inventory shortfall, major locations, trends, and forecasts all in one place. This capability would mean quick action to prevent any out-of-stock situation!
- Eliminate the unconscious bias: Building stories without unconscious bias can sometimes be challenging. We often find and create a case of what ‘we’ think is right or what the audience wants to hear. With autonomous insights, this risk is eliminated, and you can focus when you want to. Using the Illusionary product views on an e-commerce website or of a drug using a fair and multi-dimensional view can be the difference between a successful or unsuccessful campaign.
- Build a strong case: Data storytelling can help business users build a stronger case for a particular decision or action. For example, an effective decision making and marketing analytics solution may show disparate metrics about campaign traction via different channels for different regions. It would be hard to decide the best channel, but well-spun analytics may provide various winners from differing regions and save your marketing strategy.
- Get more insights with less asking: Accelerate the decision-making process. Automated insights and focus areas usually speed up the decision-making processes. Suppose you are trying to decide the next best location to supply flood relief items in a flood-affected region. In that case, instead of doing multiple analyses on which area has the most severity, distance, requirements, and stock availability, we can just view the severity distribution and get the essential information on these parameters in a single click.
This is just the tip of the iceberg.
At Lumin, our constant endeavor is to make decision-making more agile, effortless, and faster. Connected Insights is one step closer to this, turning every insight into a story waiting to be told.
Don’t forget to catch Lumin’s latest showcase at the Showfloor Showdown at Gartner Data & Analytics forum 2023 in Orlando, Florida on Mar 22, 2023 at 10:30 am EDT !
To learn more about FosfornLumin, book a demo today
 Reading Time: 3 minutes


