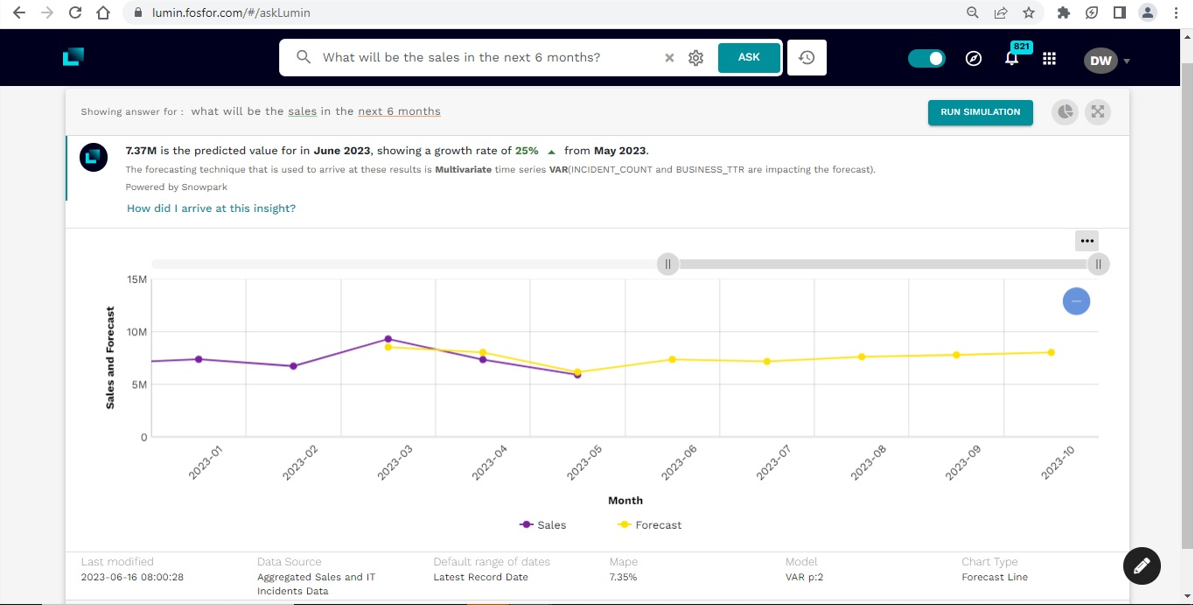
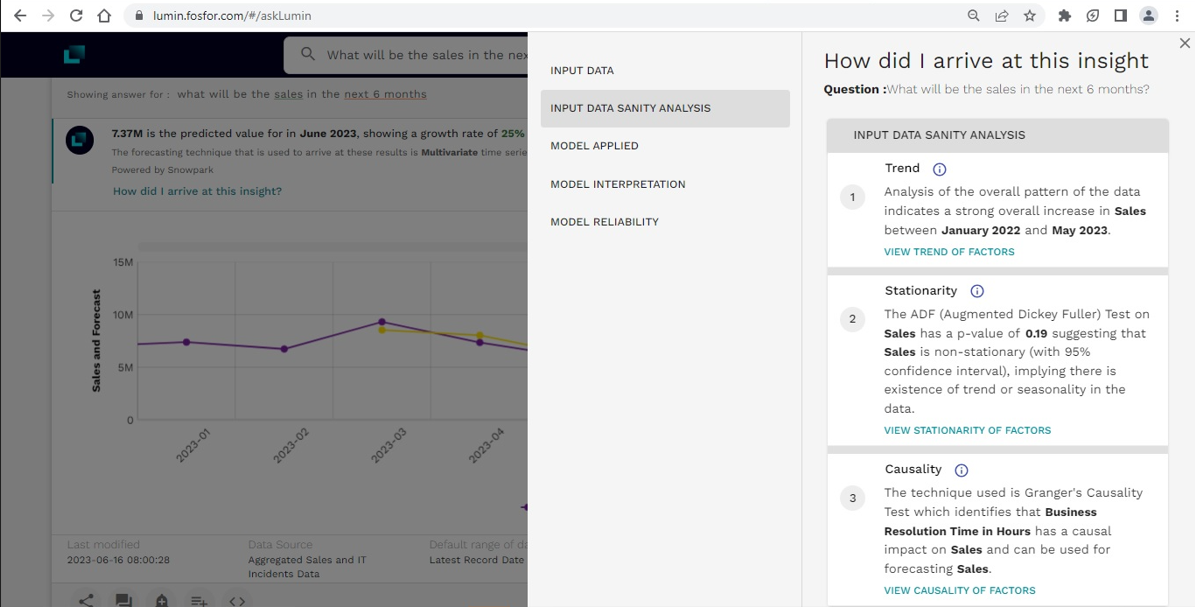
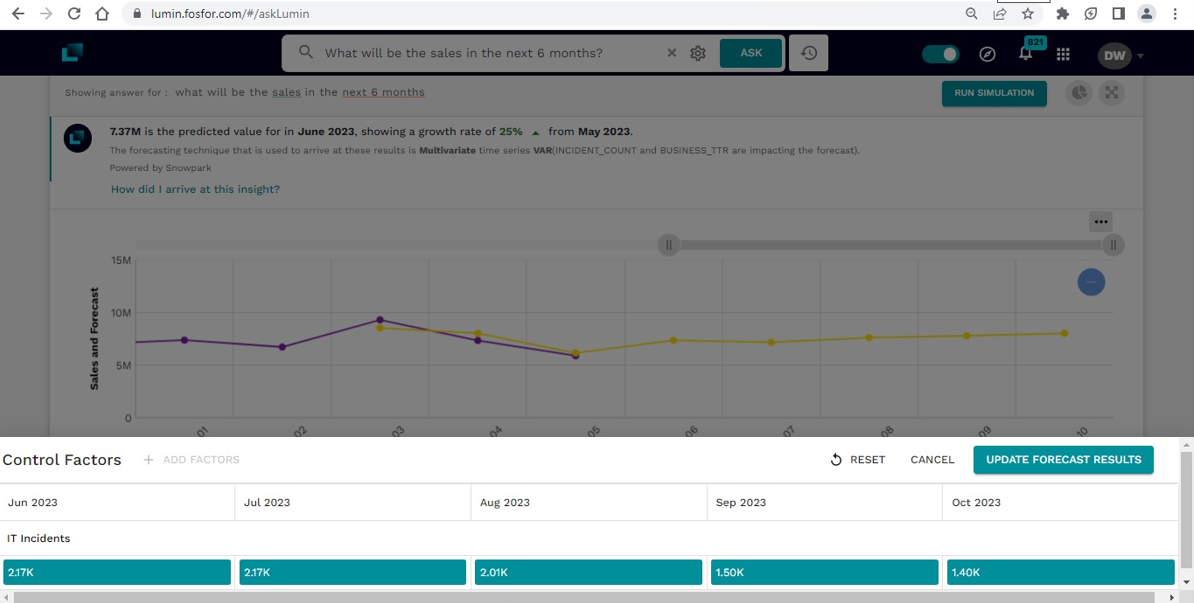
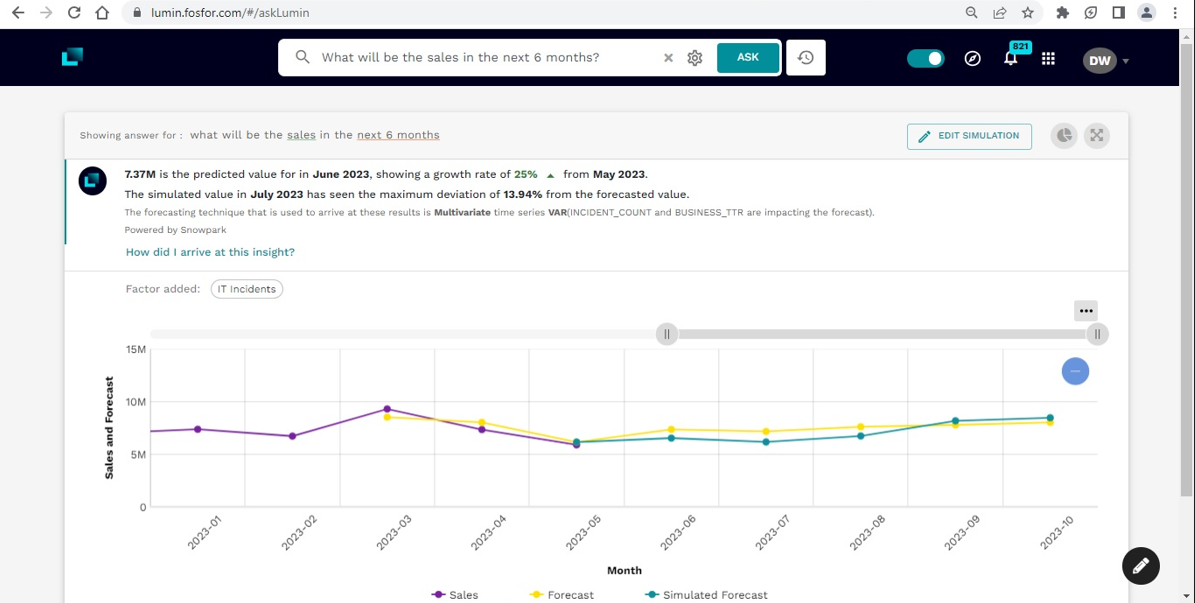
 Reading Time: 7 minutes
There is no question that the COVID-19 pandemic has profoundly impacted the way traditional retailers or new-age eCommerce companies connect with and serve their customers—from capturing their attention online, to integrating service and delivery into a superlative customer experience.
While the topmost concern of retailers in the past might have been securing optimal real estate and square footage, today a vast proportion of the customer’s experience takes place in the increasingly cluttered online arena—an eventuality that was already underway pre-pandemic, which has only been accelerated by seismic shifts in consumer behavior over the past couple of years. Now, the key factors that can make or break a brand are not just accessibility, and availability, but ease of purchase, and speed of service as well.
Despite demonstrating remarkable resilience through various adaptations such as supply chain adjustments, online sales expansions, contactless payments, digital experiences, and personalized services, retailers still have significant opportunities to enhance customer experiences, foster brand loyalty, and provide seamless and satisfactory service.
Concurrently, retailers encounter greater difficulties in managing an intricate IT ecosystem. Unexpected failures in networks or applications can directly affect ongoing business operations, thereby impacting the financial performance of the business. In extreme cases, data and monetary losses resulting from unplanned outages can even lead to the closure of a retailer’s business.
Holistic, yet granular, insights on IT incidents are critical
Amidst this volatile, uncertain, complex, and highly competitive business environment, the demands thrust upon the organization’s IT team by the business have increased significantly, and the trend continues. To cope with the speed and volume of digital transformation projects being rolled out across the organization, and the increased IT incidents that may follow, business and technology leaders require detailed and actionable information – not just on the incidents created, but also on their impact on the organization’s overall performance.
First and foremost, the standard reports generated by SaaS-based applications, like ServiceNow, aren’t fundamentally built for analytics. They do not offer the level of detail required to effectively analyze critical issues surfacing across the entire IT ecosystem. On the other hand, analyzing the (incidents) data in a silo, without really looking at their business impact, can result in recurring incidents, wastage of resources, and excessive spending where it isn’t required.
With Lumin by fosfor ServiceNow Analytics on Snowflake, the business and its IT teams can seamlessly connect with, and delve deeper into the organization’s IT incidents data. With Lumin’s advanced analytical capabilities and Snowflake’s computing prowess, users can proactively spot anomalies, accurately pinpoint the root causes of critical incidents, and align the ITOps spending basis their business impact.
The business need and the data involved
ABC Corporation is a hypothetical omnichannel retailer that sells technology and office supplies to its global clientele through its eCommerce channel. ABC Corporation witnessed robust sales in the last two quarters, viz. Q4 2022 and Q1 2023, however, the sales suddenly plummeted in March and April 2023. Around the same time, IT leaders at ABC noticed a sudden increase in incidents pertaining to technology failures – especially issues with the availability of the portal, payment gateway, etc. As a channel development and category manager, John has been tasked with diagnosing the root cause of increased incidents and corroborating its impact on future sales.
To analyze the problem at hand, John uses Lumin’s native Snowflake connector to connect to the IT incidents data (from ServiceNow), and the sales data (aggregated from the CRM, OMS, and Marketing Information System), both hosted on Snowflake’s data warehouse.
Let us step into John’s shoes as he ingests the data into Snowflake and discovers rich insights using Fosfor Lumin.
Sales data
The sales data is ingested by establishing a traditional ETL pipeline between the source systems (CRM, OMS, and MIS), and aggregating the same on Snowflake. Key attributes include:
- Key dimensions: Regions, Country, Cities, Category, Brand, etc.
- Key measures: Sales, Volume, Price, Profit, Promotion, etc.
- Key date dimensions: Order date
ServiceNow incidents data
ServiceNow incidents data is ingested using Snowflake’s native ServiceNow connector available on the Snowflake marketplace. It connects with, and ingests incident data from the following key tables in ServiceNow into the Snowflake Data Warehouse.
| INCIDENT | CONTRACT_SLA |
| CMN_LOCATION | SERVICE_OFFERING |
| SYS_USER | SERVICES |
| SYS_USER_GROUP | CONFIG_ITEM |
| TASK_SLA | CORE_COMPANY |
As seen in image 1 below, the connector allows John to select the necessary tables from among the 8000+ tables he has access to. The connector syncs with ABC’s ServiceNow instance and autonomously refreshes the data at a set frequency – 24 hours in this case.
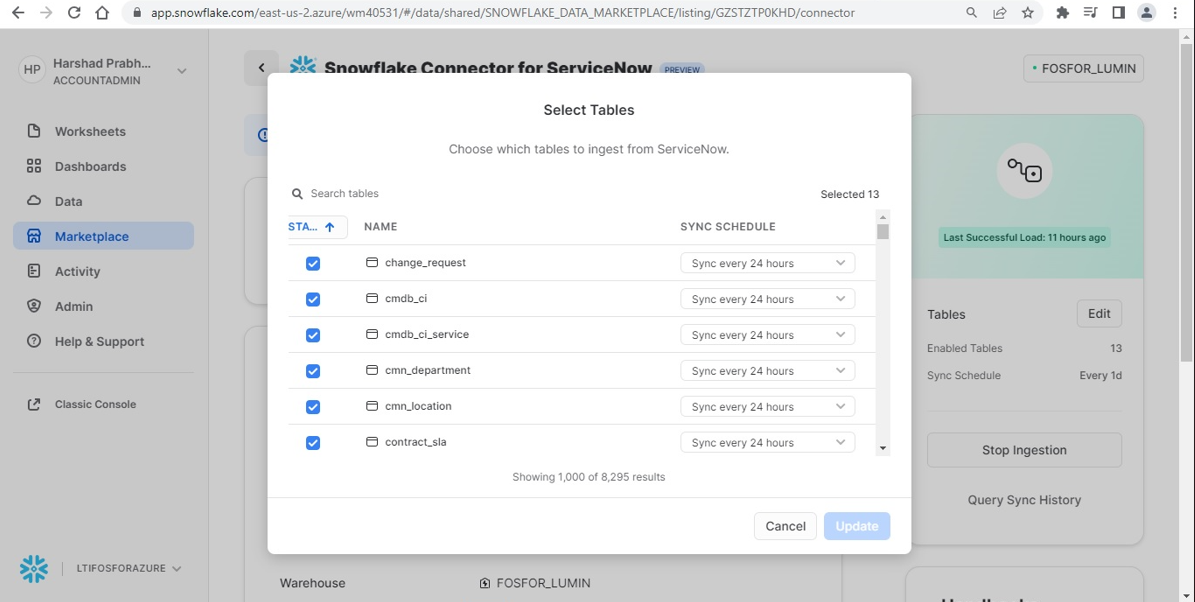
Image 1 – Configuring Snowflake’s native ServiceNow connector
Upon the completion of the necessary configurations, the connector automatically creates a database and a schema as showcased in image 2. Subsequently, it populates the schema with the selected data tables (raw data) and creates corresponding views (flattened data) for analytical consumption.
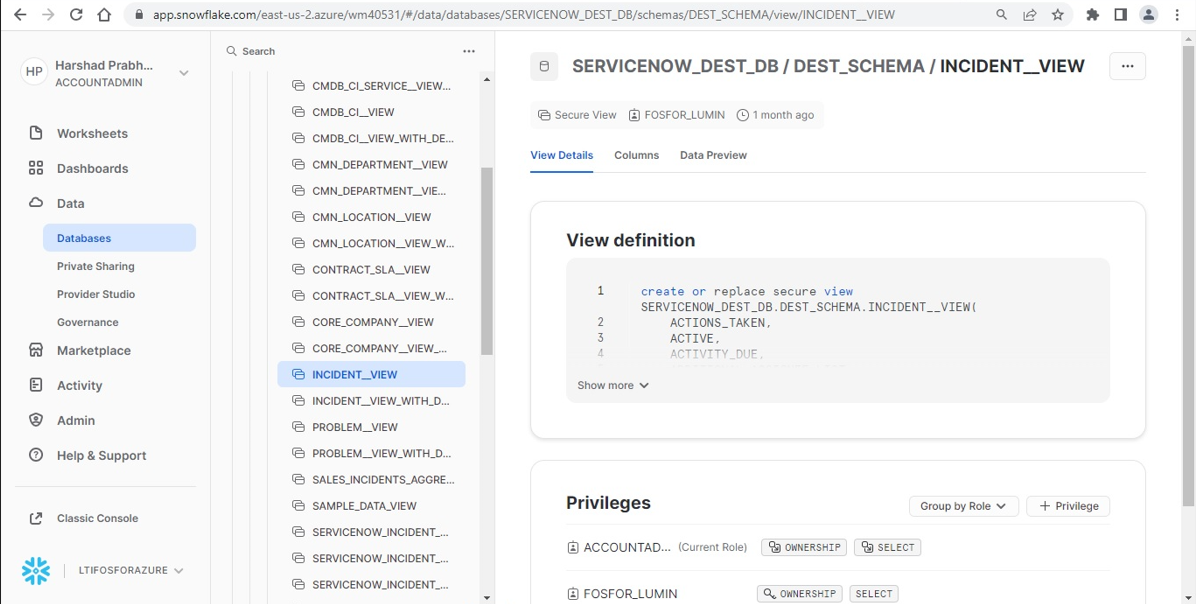
Image 2 – Snowflake’s ServiceNow connector automatically creates the DB, Schema, and tables/views for the selected tables in ServiceNow
Key attributes include:
- Key dimensions: Category, Assignment Group, Country, Contact Type, Incident State, Closure Code, Priority, Escalation, SLA
breach, etc. - Key Measures and KPIs: Number of incidents, Number of open incidents, Number of incidents resolved, Time to Resolution (TTR),
Average TTR, Number of incidents opened and resolved the same day, Number of incidents resolved by self-service, etc. - Date dimension: Incident Created Date, Incident Opened Date, Incident Resolved Date, Incident Closed Date, etc.
As the next step, John leverages Lumin’s native Snowflake connector to connect to the above Snowflake instance (and the underlying ServiceNow DB and schema that hosts the incidents and sales data) for building this use case solution (see image 3 below).
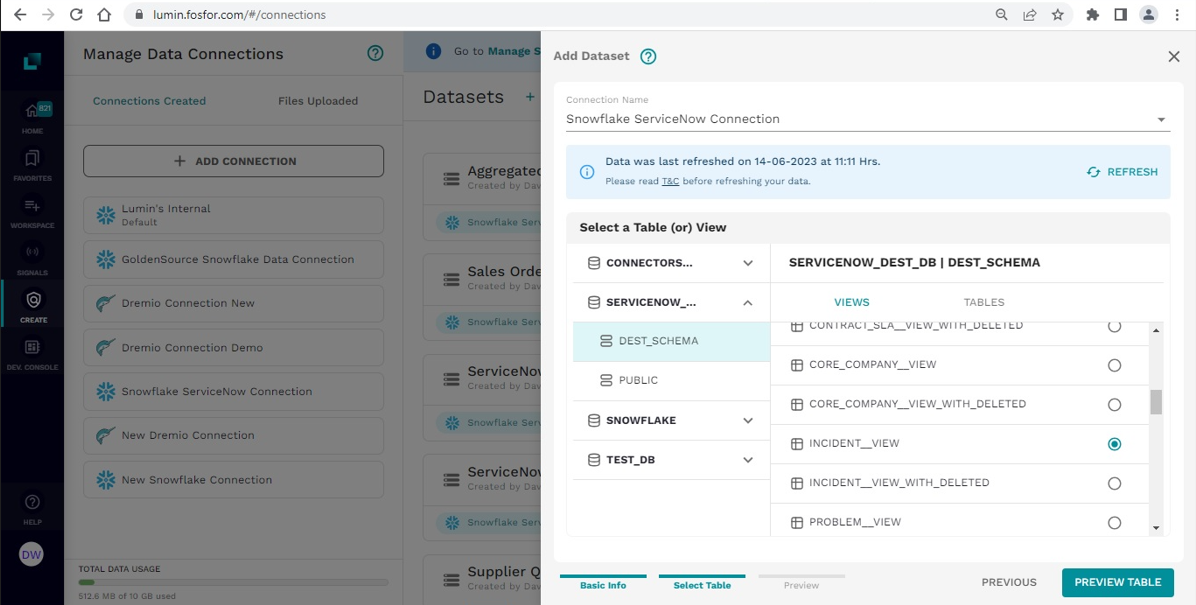
Image 3 – Lumin’s native Snowflake connector seamlessly connects with the ServiceNow data ingested in Snowflake
In this hypothetical demonstration, we can see the differentiated capabilities of Lumin by Fosfor that can provide the CIOs, ITOps professionals, and Service Desk Personnel a holistic view of their entire IT operations with consumer-grade analytics, powered by natural language search and AI.
Descriptive analytics to help you explore the sales and incidents data
John can start his insights exploration journey with a simple descriptive analysis of sales and incidents, particularly looking for their trend in the last year and a half.
In order to arrive at the insights he is looking for, he asks the following in simple language:
Question 1: “What is the trend of sales and incidents in the last 18 months?”
The below image is a representation of the response that Fosfor Lumin would offer John.

Image 4 – What is the trend of sales and incidents in the last 18 months?
Lumin understood his question in natural language and converted it into an analytical query which, in this case, included the time filter of 18 months. It is interesting to note that the 2 measures, viz. sales, and number of incidents, come from two disparate data tables on Snowflake, but are visualized on the same trend chart. From image 4, it is evident that historically (as well as in April and May 2023), an increase in incidents has resulted in a drop in sales for ABC Corporation. This is interesting, but as a business user, it is important for John to quantify this correlation and potential causation. He can go ahead and ask the question to Fosfor Lumin.
Question 2: “What is the correlation between sales and incidents?”
As expected, Lumin identified a strong negative correlation between sales and incidents with a Pearson correlation coefficient of -0.97 as highlighted in image 5. It is worth noting that Lumin not only selected the best-fit visualization to represent the insight but also generated a contextualized narrative, in English, to explain the same.
Though correlation is a measure of association and not causality, it is very likely that in this business context, an increase in incidents can lead to a loss in sales which needs further investigation.
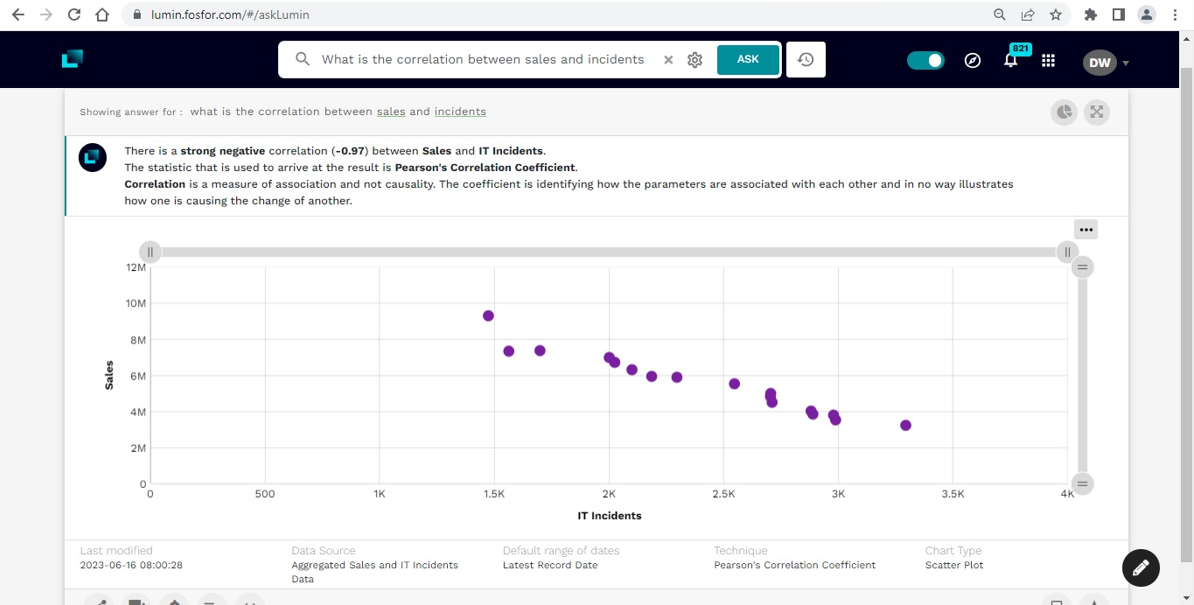
Image 5 – What is the correlation between sales and incidents?
As the next step in the investigative journey, John can further do a deep dive into incidents and look for its growth trend.
Question 3: “What is the monthly growth rate of incidents?”
As you can see in image 6, Lumin by Fosfor understands the intent of the question and presents not only the trend of incidents, but also the M-o-M growth. Clearly, the rate of growth of incidents has shown an uptrend since March 2023, with the incidents growing by ~35% in May 2023.
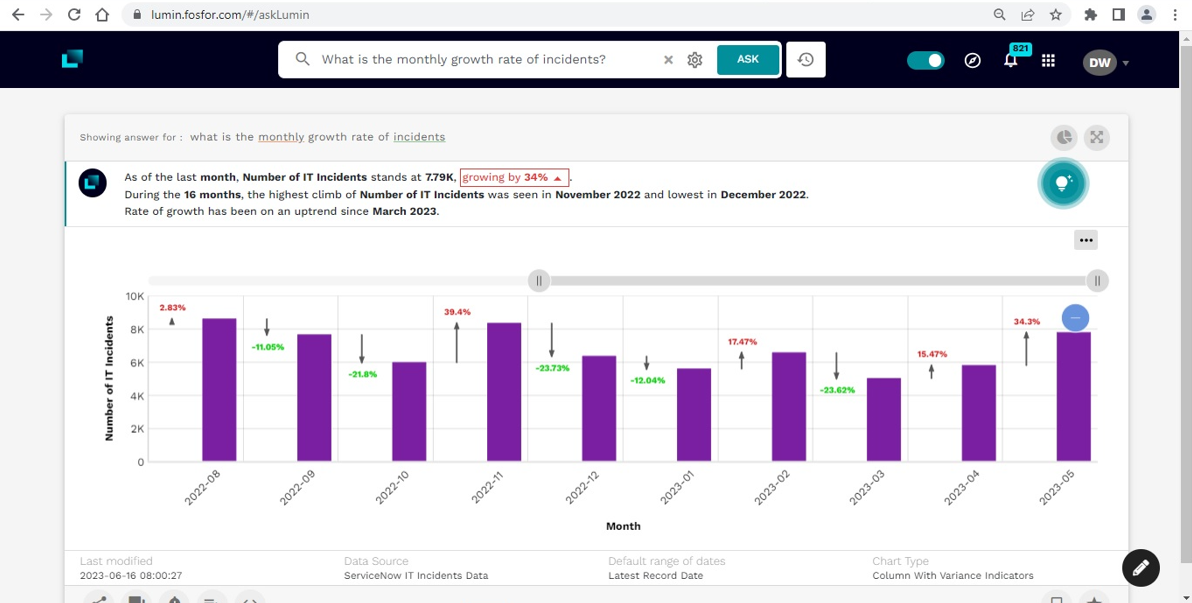
Image 6 – What is the monthly growth rate of incidents?
Lumin provides John with some powerful personalization and collaboration features that allows him to:
- Export the underlying data.
- Switch the charts (as per his liking) from across a library of charts suitable for representing the insight.
- Share the insights with his colleagues within the organization.
- Add comments (his understanding, observations, POV, etc.) on the insights while he collaborates with a larger team.
- Create personalized alerts and signals to better track the metrics or KPIs, and get notified when they breach a user-defined threshold.
- Capture the insights, as he goes about his exploratory journey, in an insights storyboard called a workspace. The workspace can also be shared with his colleagues within the organization.
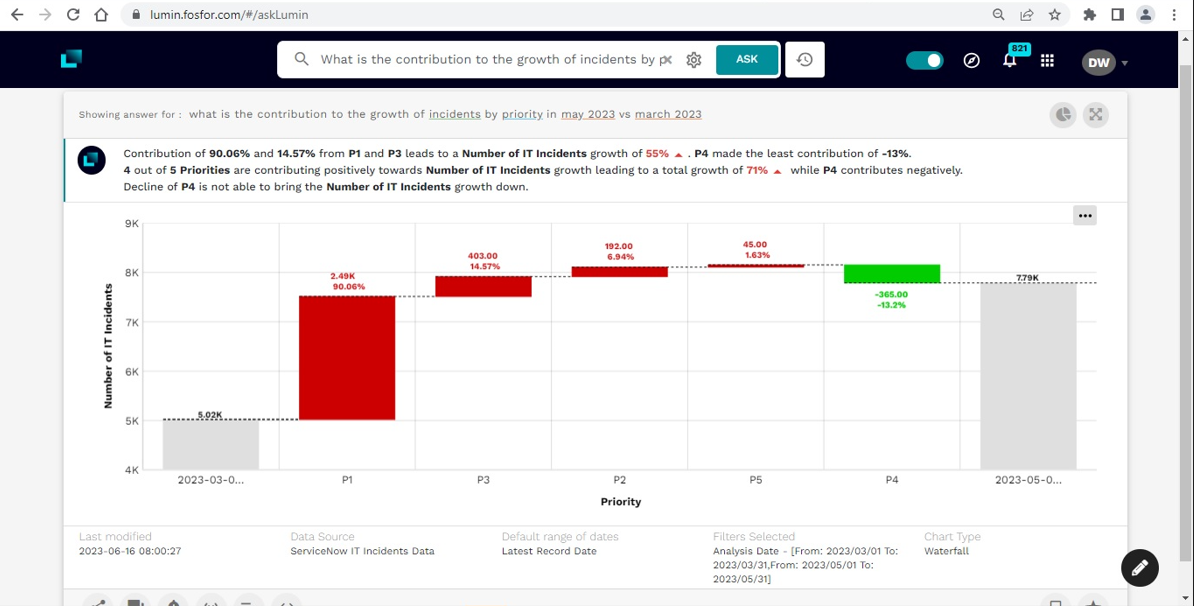
The sudden increase in incidents since March 2023 is a sign of worry; however, it is important to understand how the incidents stack up, based on their priority. High priority incidents (P1) have a greater business impact as compared to a low priority incident (P5). John can ask Lumin this fairly complex question in simple conversational English.
