 Reading Time: 4 minutes
Brand analytics is crucial for any Pharma manufacturer’s success. During the drug research and development phase, Pharma manufacturers spend millions of dollars, and consume 10-15 years to bring much needed drugs to the market, with only 7-12 years of patented time available. This makes it critical to have an effective go-to-market strategy, and a continuous monitoring of the brand to maximize revenue.
Brand analytics in action
- Unable to create a single source of truth.
- Delayed data-to-insight journey.
- High churn time on ad-hoc analyses.
Lumin and Snowflake, present a comprehensive solution to all these challenges. With Lumin’s Pharma brand book, powered by Snowflake, decision makers in the Pharma value chain can obtain critical insights at speed and scale. With Lumin’s advanced analytical capabilities and Snowflake’s computing prowess, users can proactively address brand trend breaks, accurately pinpoint root causes, and simulate potential spending corrections, ultimately maximizing business impact. The following use case illustrates how a Pharma major can optimize their brand potential.
The datasets and KPIs
The data’s schema consists of the following parameters:
Key dimensions
- HCP (Health Care Professionals) demographics
- Payer channel
- Payer information via which the prescription is dispensed through
- Call planning & targeting
Key measures
- Monthly prescriptions at the HCP level, over 24 months
- TRx = Total Prescriptions
- NRx = New Prescriptions
- NBRx = New-to-Brand Prescriptions
- NTS = New-Therapy-Starts
- Sales Activity:
- Personal call detailing
- Remote calls
- Veeva approved emails
The data used for this use case is an amalgamation of multiple in-house data sources (Sales Force Zip-to-Territory, sales activity, and sales targeting), and multiple third-party sales datasets from IQVIA’s Xponent PlanTRAK and Prescribing Dynamics products. These third party datasets are obtained directly from Snowflake’s marketplace, and the final aggregated data with in-house data sources is hosted on Snowflake’s warehouse, connected via Lumin’s in-built Snowflake connector. (See image 1 below)

Image 1 : Connecting to aggregated IQVIA data with internal datasets hosted on Snowflake’s Data Warehouse
In this blog, we walk you through the data-to-decisions journey of a marketing manager of the brand ‘Zeldatab’, running a descriptive analysis exercise to analyze the brand and its competitors.
Descriptive Analysis with Lumin
Starting simply, a brand manager would want to know what their brand’s share is against its competitors. With Lumin, we can type in the question in simplelanguage as shown below, and a comprehensive analytical answer is presented as seen in image 2.
What is the share of sales by brands?

Image 2: Brand share in July 2023
To break things down – Lumin understood our question in plain English text and converted it into an analytical query, where in this case it has also included a relevant time filter for the latest month.
Now that we know that the brand share is 33.94%, it would be interesting to see how the business has been growing over time.
What is the monthly growth rate of Zeldatab?

Image 3: Month-on-Month growth of Zeldatab. Also highlights few features of Lumin viz. data export, chart switcher, and connected insights.
As you can see in image 3, Lumin dynamically selected the best-fit visualization to analytical result, while also generating a contextualized narrative to explain the same. As a brand manager, I would now be concerned about the recent drop in sales I notice in May 2023, and would like to deep-dive into this.
Before we explore that,it is important to note that Lumin also allows us to:
- Export the underlying data to share with colleagues.
- Switch chart visualization to see growth trends.
- Access easy exploration of next analyses through connected insights.
On clicking the connected insights button (3), Lumin provides us a set of simple and advanced analytical questions closely related to the metric or KPI that we are exploring. As you can see in image 4 below, Lumin has proactively nudged us to ask the next question indicating the predicted future sales of Zeldatab.

Image 4: Connected insights feature of umin
As the next logical step, it would be prudent for the brand manager to identify which payer channel is contributing to this decline of growth seen in May 2023.
What is the growth contribution by payer channel for Zeldatab in May 2023?
As a brand manager one of the major levers of change to consider, would be the payer channels. The formulary status plays a crucial role in how a drug is dispensed at the pharmacy and what drives an HCP (Health Care Professional) to prescribe the drug. As seen below in image 5, Lumin has identified that there is one major payer channel contributing to the drop – the commercial channel.

Image 5: Waterfall chart showcasing growth contribution of payer channels for Zeldatab in the month of May 2023.
Lumin also provides us with some powerful collaboration features that allow us to (refer image 5):
- Share insights with your colleagues.
- Add comments (understanding, observations, POV, etc.) on the insights while you collaborate with your colleagues.
- Create personalized alerts and signals to better track the metrics or KPIs.
- Get notified when there is a breach in a defined threshold.
- Capture the insights as you go about your exploratory journey, in a storyboard format called workspace. (Note: The workspace can further be shared with your colleagues just like how PowerPoint presentations illustrate a story)
Deep dive and diagnose brand trends with Diagnostic Analytics
Now, since we have zeroed-in on the major cause of the growth drop– the commercial payer channel, the next question a brand manager would logically present is why the sales rate through the commercial channel is declining?
Why has commercial sales for Zeldatab changed in May 2023?
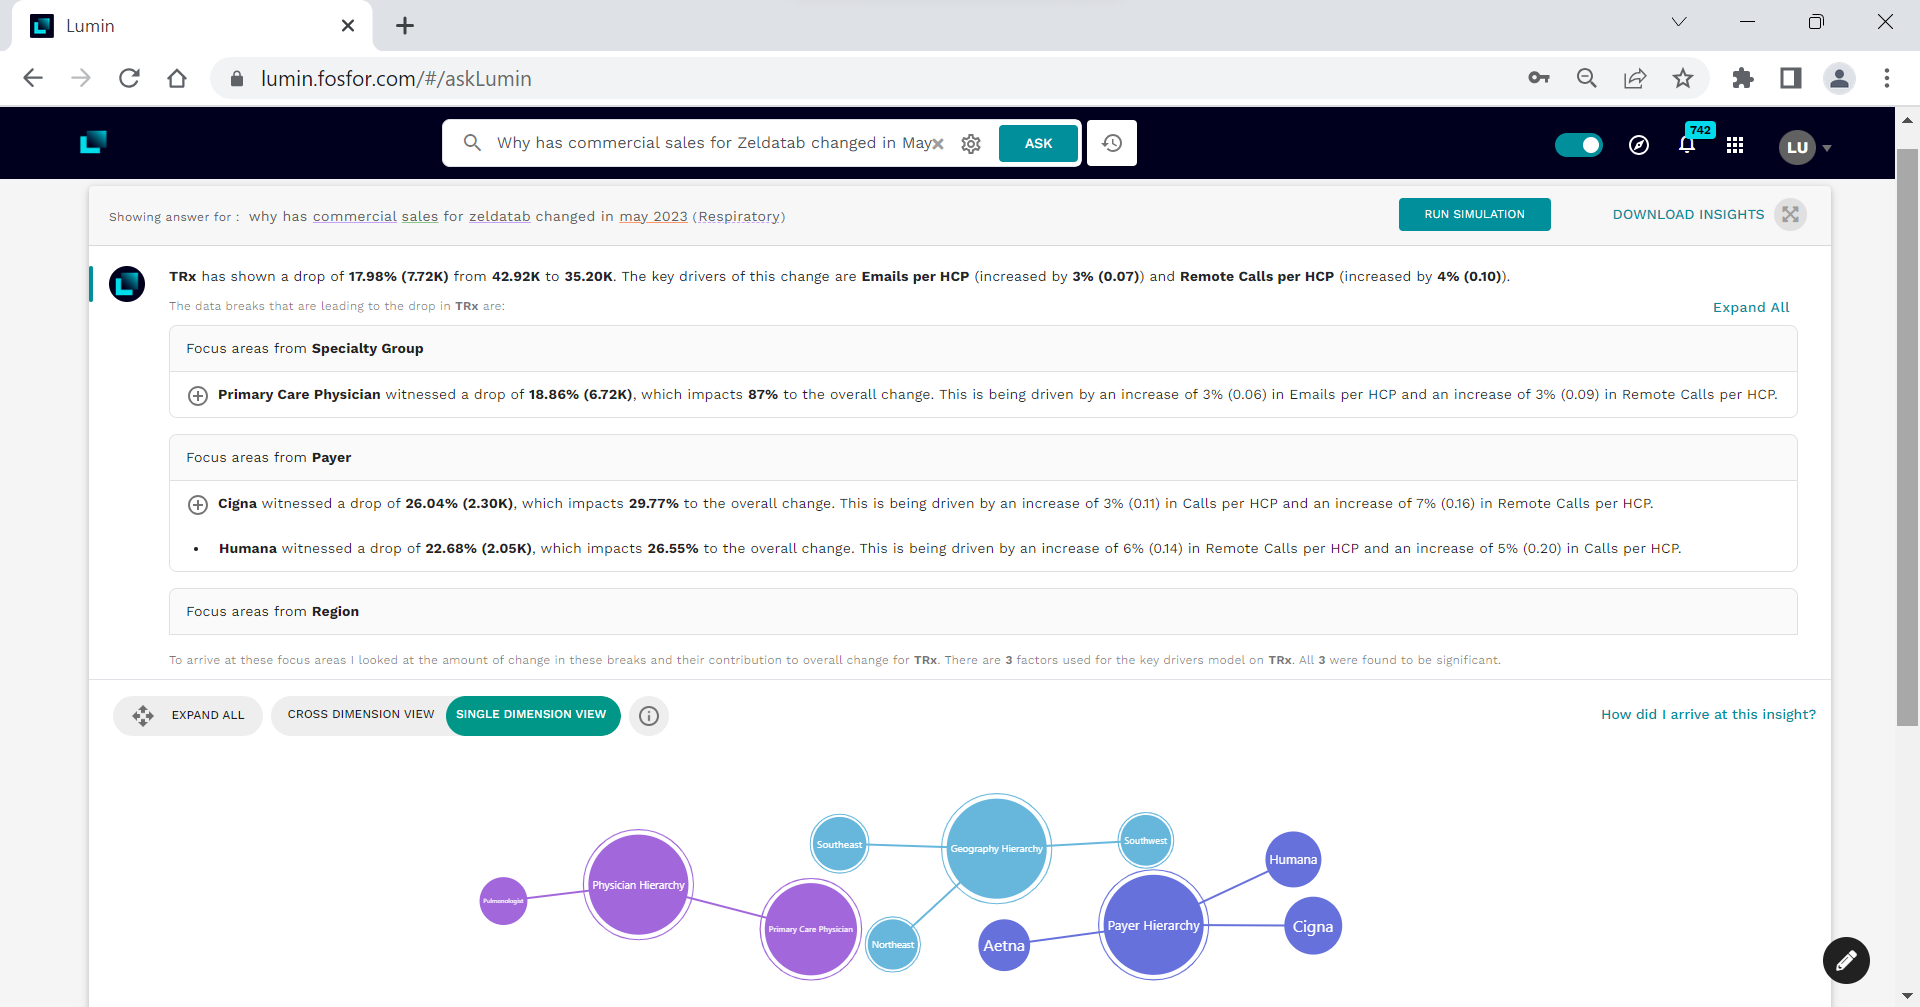
Image 6: Deep-dive analysis on decrease in commercial sales for Zeldatab
As seen in image 6, Lumin performs an analysis across hierarchies such as Geography Hierarchy (region, district, territory), Physician Hierarchy (physician specialty group, physician specialty), and Payer Hierarchy (payer channel, payer) all in a matter of seconds. Lumin presents before us a detailed narrative along with an interactive bubble chart that presents the deep-dive analysis within each hierarchy.
From the chart, we can see that there are 3 key contributors to the decline of sales: Primary Care Physicians, Humana (Payer), and the Southeast Region. Now, although the analysis is precise and insightful, a business user is fair to question the reliability of this information presented. Lumin has just the answer for it – XAI(Lumin’s Explainable AI feature). Just like how an analyst would provide context on their analyses, Lumin has the capability to meticulously explain (in detail) the various steps involved in arriving at this insight.
Lumin provides a comprehensive step by step explanation all the way from the input data to the model reliability of the analyses as seen in Image 7.
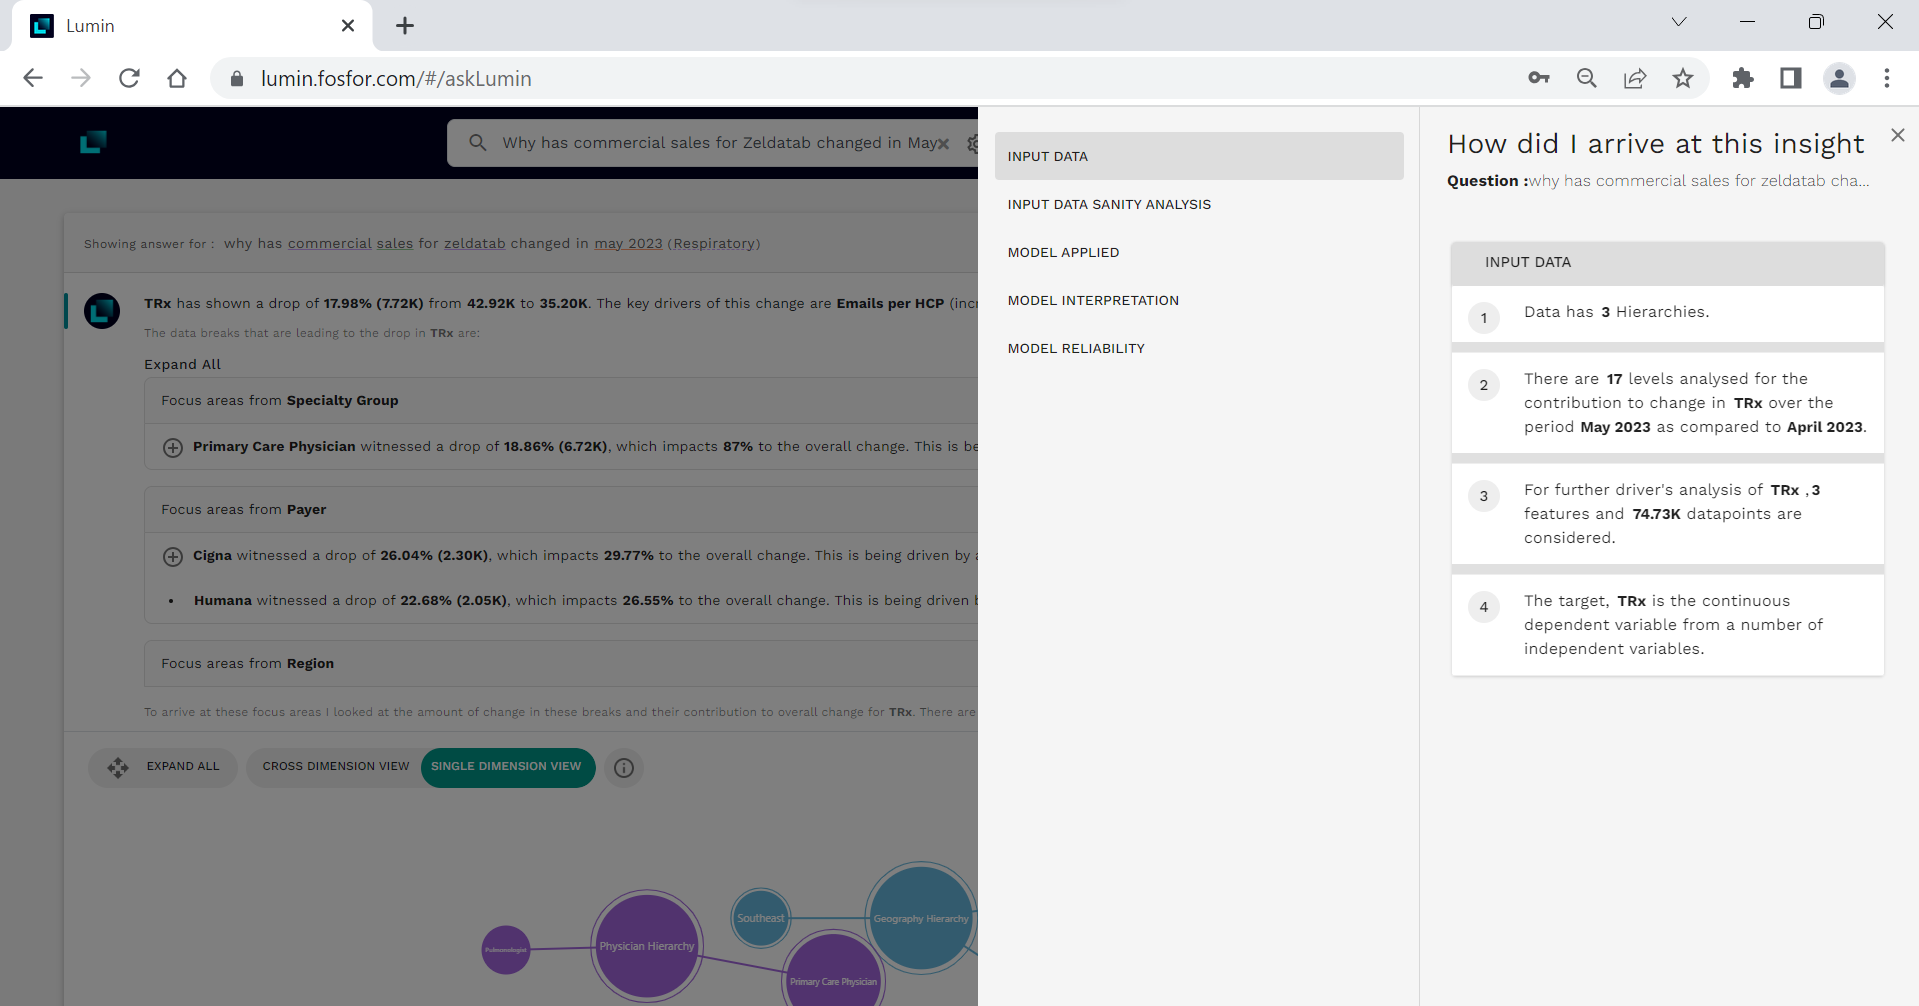
Image 7: XAI (Explainable AI)
The logical next question for any brand manager would be, “how do I influence change to improve the declining sales?” Lumin’s versatile ability to run simulations to alter various promotional activity deployed provides the perfect answer.
Lumin through the run simulation option can perform this cumbersome task in a matter of seconds. First the brand manager can choose and focus on the key contributor (primary care physicians), by applying necessary filters as shown in image 8.
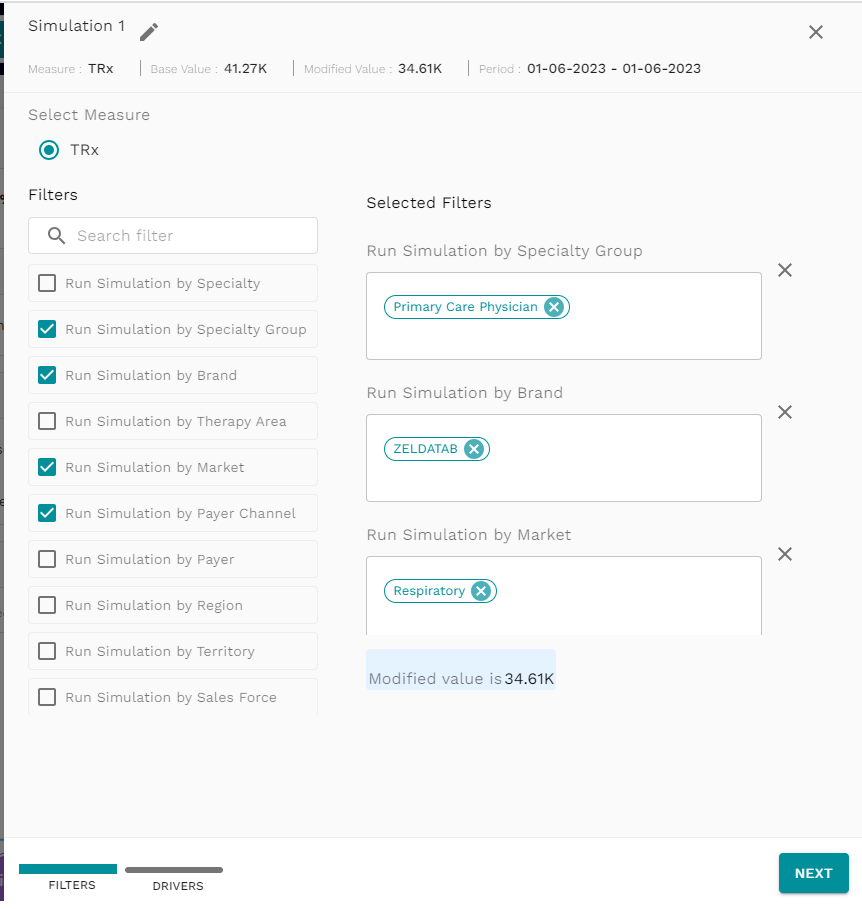
Image 8: Applying relevant focus filters to simulate.
Now let’s adjust promotional drivers such as Calls per HCP by 20%, Email per HCP by 10%, and Remote calls per HCP also by 20%, as shown in Image 9, to see how best it impacts the sales of Zeldatab.

Image 9: Adjusting promotional drivers
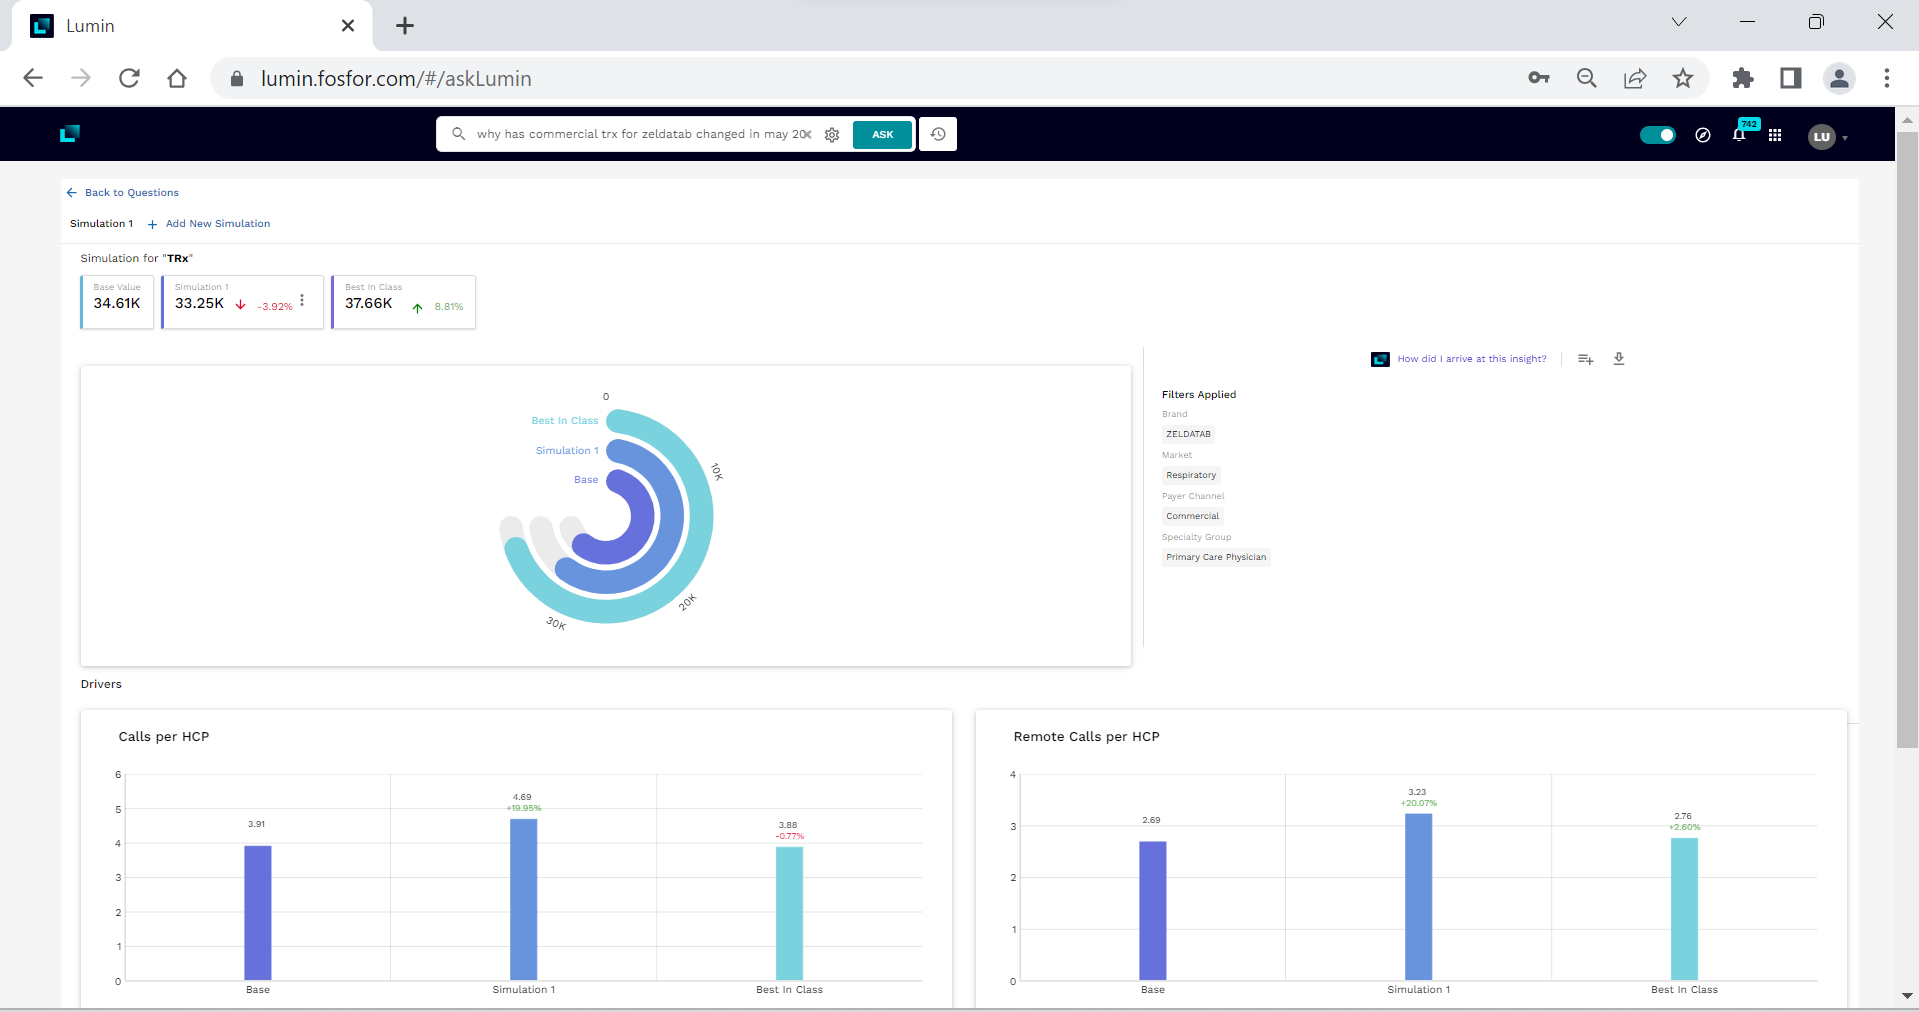
Image 10: Simulation
As you can see in image 10, Lumin provides quick results of the simulation and explicitly specifies the best-in-class simulation results along with the optimal change in promotional drivers.
It is worth noting that Lumin uses Snowpark to run these intense analytical workloads, such as diagnostics, simulations, and forecasts, there by providing business users with the ability to dynamically query and process their data within the Snowflake environment. Snowpark further accelerates the querying process and keeps the data secure as it moves between storage and processing.
Expect the unexpected with Lumin’s smart nudges feature
Now that we know how to analyze the known easily through cursory analysis, what about the hidden changes and unexpected trend breaks?How does Lumin assist in expecting the unexpected?
Here’s how: Lumin has powerful foresight capabilities- with its autonomous nudges feature, it identifies anomalies in the data of critical KPIs and hierarchies, and “nudges” the user to pay necessary attention to critical change. Lumin’s anomaly engine synthesizes millions of data points in seconds to give business users the insights necessary to be a step ahead of potential change. By analyzing the trend breaks in detail, Lumin answers the critical questions of when, why, and to what degree of any foreseen change.
For this example, we have set up autonomous nudges for TRx by payer hierarchy to identify any potential changes, and as you can see in image 11, the autonomous nudges feature has proactively worked out the trend break, and presents nudges as well for the brand manager to act on.
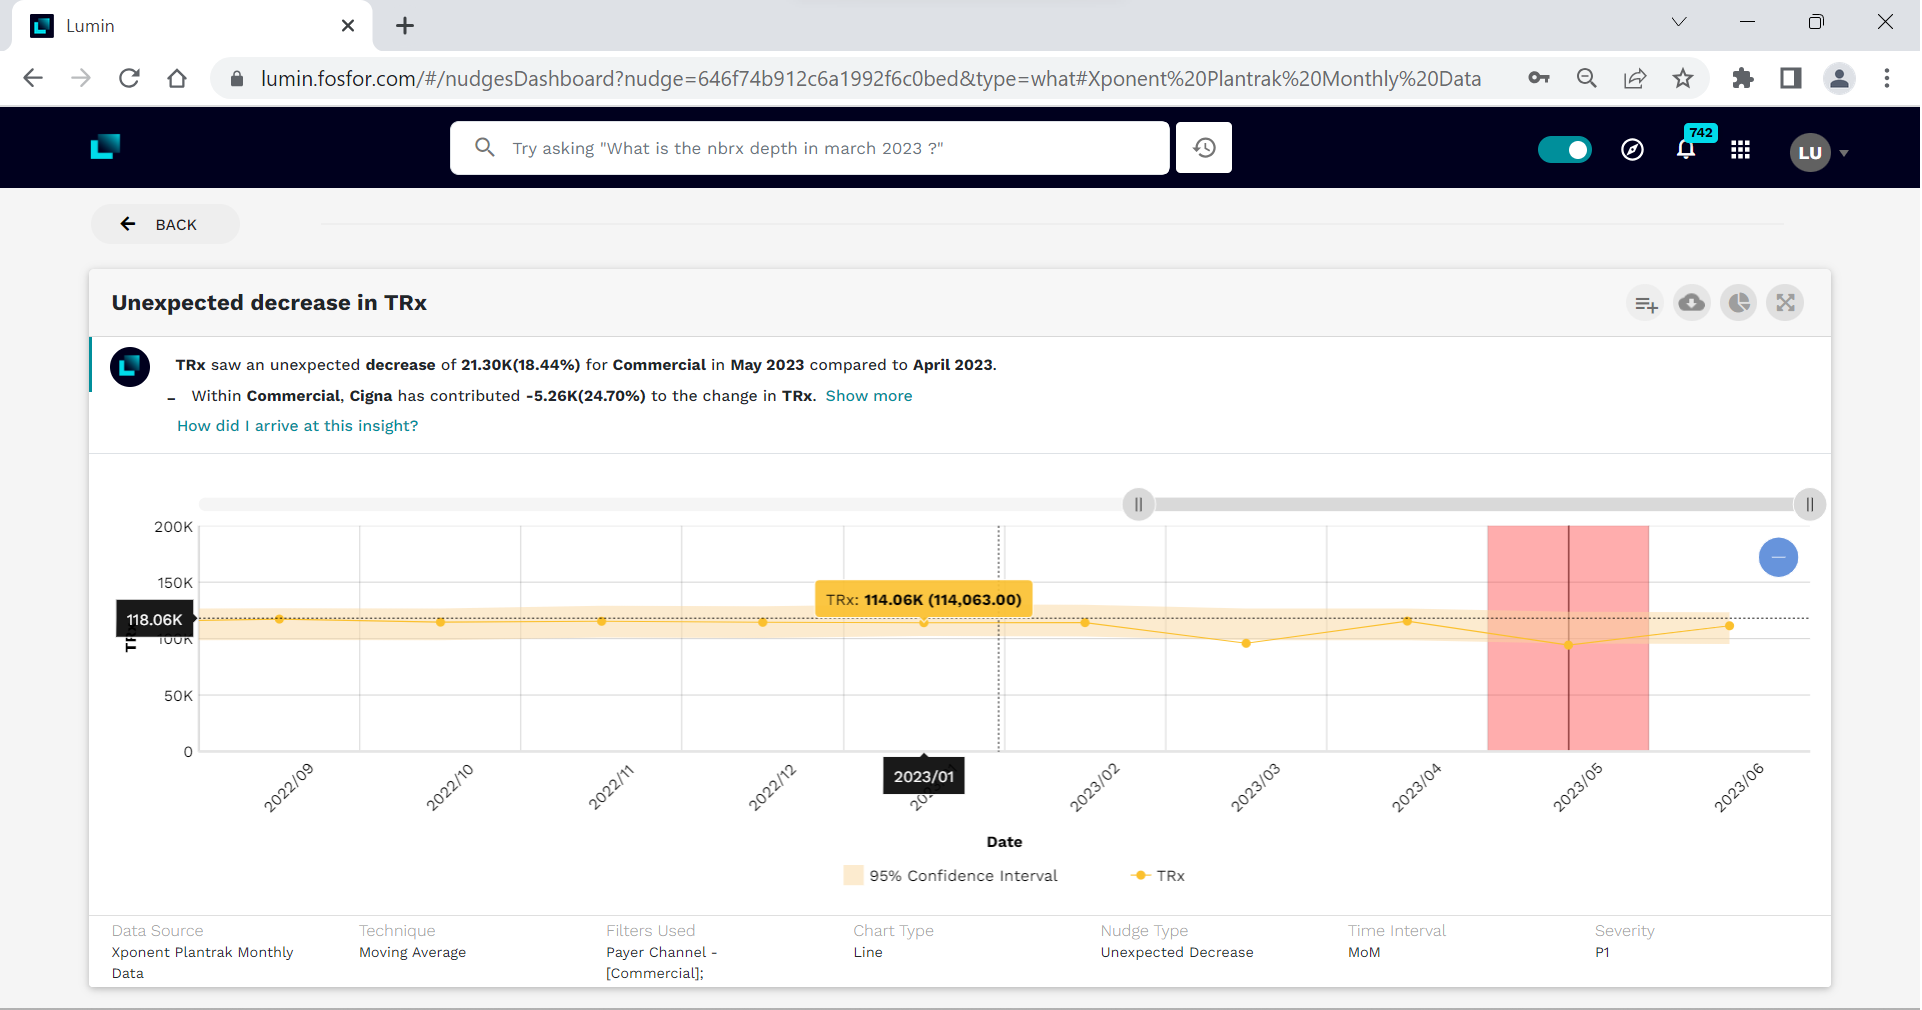
Image 11: Autonomous nudge detected the unexpected decrease in commercial sales in May 2023
Get a sneak peek into the future:Identify the sales trend of your brand using predictive analytics
We have seen so far that the brand manager has the capability to analyse and foresee future changes and trends through the automated nudges feature. The next logical question could be, “can I truly look into the future and see where my brand is headed?”
Lumin with its predictive analytics feature, can easily help answer that line of thought. We can ask Lumin to predict the sales trend with the question below.
What are the expected commercial Zeldatab sales in the next 3 months?
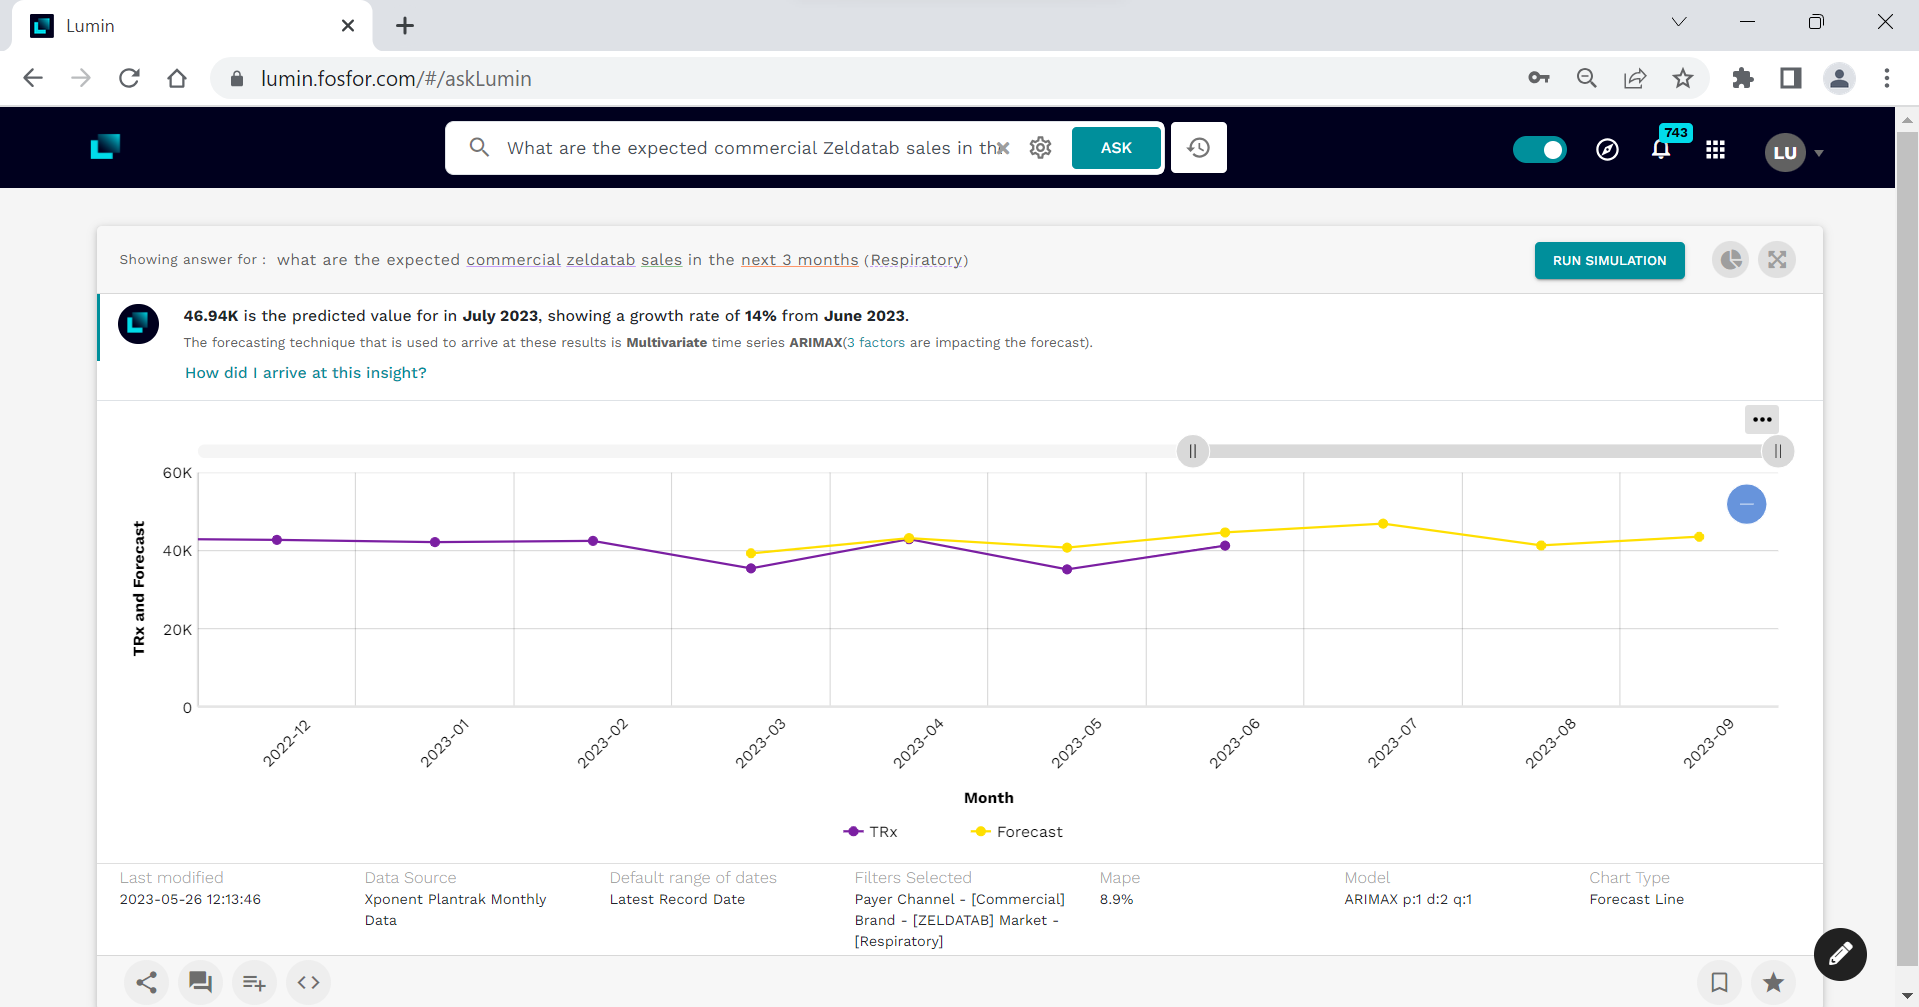
Image 12: Forecast of commercial payer sales of Zeldatab
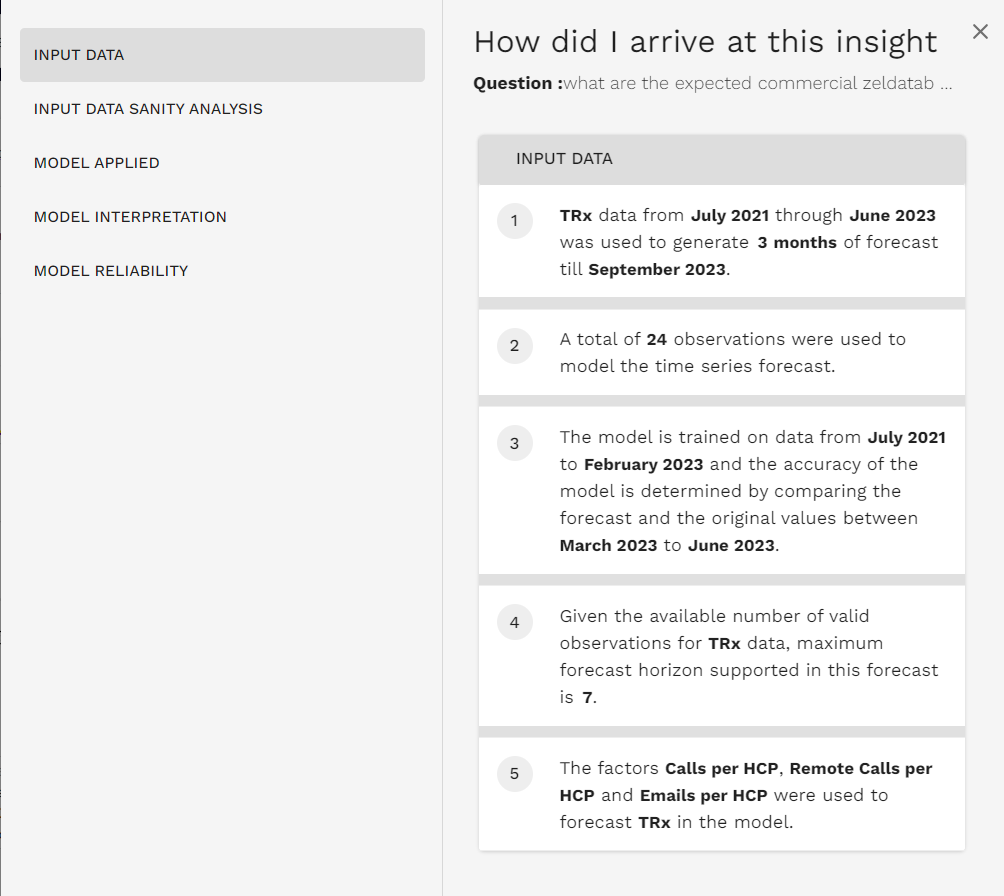
Image 13: XAI (Explainable AI) for forecast
Lumin, through its natural language processing capabilities, understands we are trying to predict sales for Zeldatab and invokes the forecasting module to run multiple multi-variate forecasting models in its analytical engine, and presents the most accurate model as an output. For our question, Lumin selected the multi-variate time series ARIMAX model for predicting TRx sales. (See Image 12)
As mentioned earlier, to usher in trust and transparency, Lumin provides a detailed explanation of the analyses from input data, its sanity, the prediction models applied (including accuracy), and how we interpret them, along with the reliability of the models. (See Image 13)
Summary
With the power of Snowflake +Lumin, comprehensive brand analytics can be performed in a matter of minutes, which typically takes weeks. Lumin can serve as the single source of truth that all key decision makers in the commercial value chain can utilize. The simple ability to ask questions and obtain immediate answers accelerates any brand manager’s data-to-decision journey, and is a must have for every growth seeking Pharma company.
Curious to know more?Book a demo and take a sneak peek at Lumin by Fosfor.
 Reading Time: 4 minutes


